Indicators Algorithms INTELLECT.city

Trade anywhere, anytime! Algorithms in your pocket make trading mobile, helping you increase your income.

INTELLECT_city - Index inside %


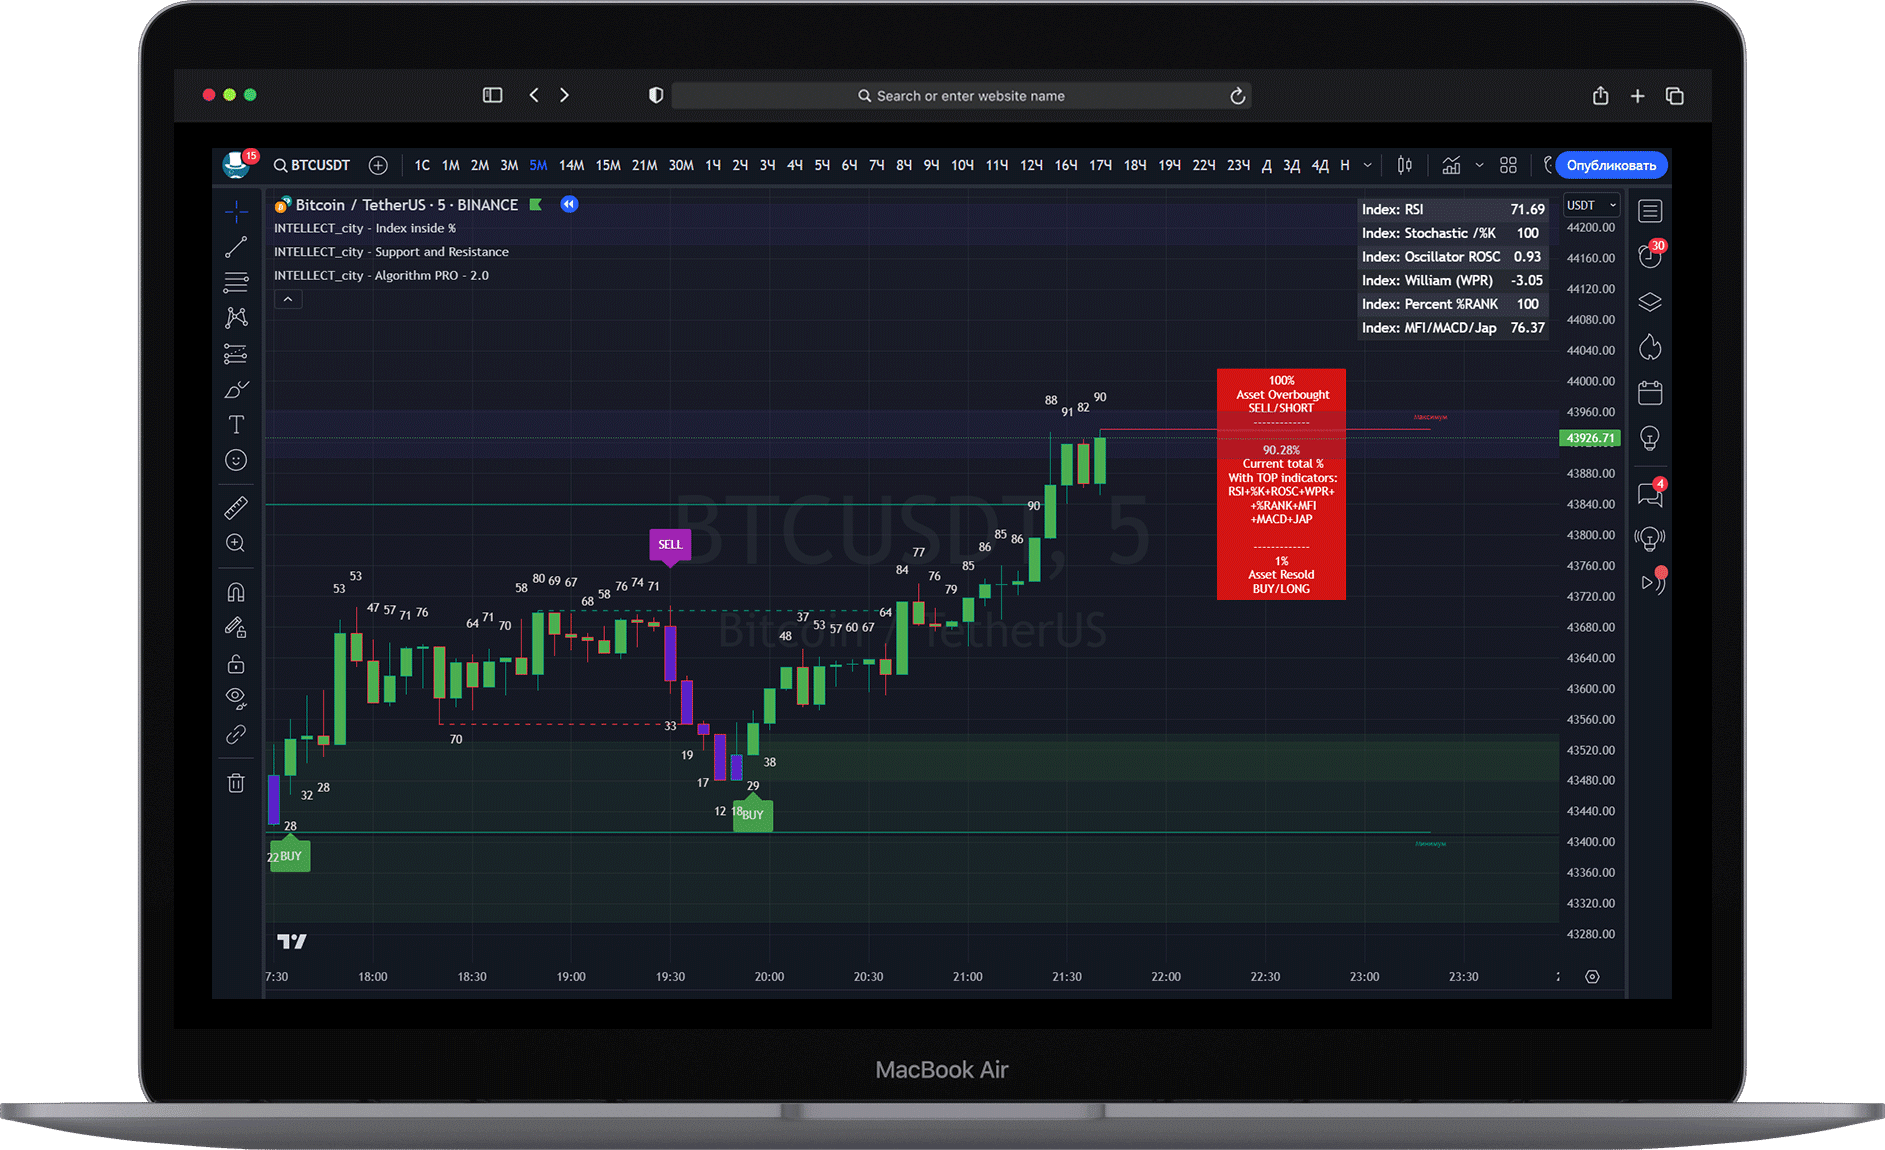
"INTELLECT_city - index inside %" - The algorithm (Indicator) shows the market sentiment, trend definition, and the index of all internal stock indicators already built into the crypto segment.
This tool takes data from all TOP indicators: RSI + %K + ROSC + WPR + %RANK + MFI + MACD + JAP and shows the overall average percentage of all TOP indicators.

Full list of built-in indicators in "INTELLECT_city - index inside %":

Relative strength index (RSI), Stochastic %K (%K), Linear Correlation Oscillator (ROSC), William Percent Range (WPR), Percent Rank (%R) Percent Rank (%R) Money flow index (MFI) Money flow index (MFI) + Convergence-Divergence + Japan Trade

In other words: All stock indicators are built into 1-n, and it shows the total value as a percentage.
The indicator is an implementation of a histogram in percentage terms, the purpose of which is to reflect market sentiment set by several normalized oscillators.

The meaning of the total percentage:
If the market sentiment is close to 100% overbought
If the market sentiment is close to 1% oversold

PS: It is preferable to choose the timeframe "2H (2 hour)" \ 3H (3 hour) \ 4H (4 hour) --- If in the long run 1D (Daily) \ 3D (daily if possible)
At the same time: you can look at the indicators on several timeframes at the same time.
For example, combine:
"23 hour (or daily)" together "with 2 hour" so that the indicators are the same, and find ideal entries, but then you will have to wait a long time, but the trader's rule always says "Time is the head of everything" Wait, wait and wait again.

Also works on all timeframes at your discretion, from - 15m (minutes) to Daily, It is not advisable to use from 1m to 5m Times, but if you are engaged in scalping, be careful, the data is also shown on the 1-5 second timeframe.

If you are a holder and trade long, the 3D timeframe is recommended (3-day timeframe), if there is no 3-Day then 1-Day.

Important:
- Oversold indicators: 1-2-3-4% on large timeframes from 2H (2 hours to Weekly) is better not to wait, also: 96-97-98-99-100% overbought.

- The higher the time frame, the more difficult it is to see small indicators 1%-10% or 90%-100%
- The lower the time frame, the easier it is to see small indicators 1%-10% or 90%-100%

- In a Bullish market, it is better to look for coins that are in a drawdown (oversold, fell in price, on correction)

- In a Bearish market, it is better to look for coins that are overbought (high indicators)

- In a Flat market, indicators of both sides are caught (High and low)

--------------------------------------------

IMPORTANT:
- An alert system has been added, you can independently choose a project for yourself and set up an alert by entering the desired values ​​​​in the indicator settings.
1) For example, take Bitcoin, or any other coin, choose a suitable time frame for yourself
2) On the chart where the indicator is already enabled, set the values ​​in the settings (the gear button is next to the indicator name).
In the settings: Where overbought, for example, set the number: "7" this means that it will notify from 1% to 7%.
if you set where the values ​​are oversold "94%" then it will notify from 94% to 100%.
3) Then create in the section itself "notification", on the upper right on the chart, or on mobile look for the button: "notification", then "add notification", subsection: "Settings" select the indicator from the list (Condition) name: INTELLECT_city - Index inside %, How to call the notification: "At any call of the alerts function" (This means that both overbought and oversold values ​​​​will come) by the values ​​​​that you set (numbers) - Name, and go to the subsection: "notifications" the way to notify you.
Or the option in the subsection "settings": instead of choosing: "At any call of the alerts function" you can set "Notify separately, namely: "minimum values" or "separately "maximum values" which gives even more functionality, where you can choose, for example: What kind of trigger to produce? We recommend: "Once per Bar" or at your discretion. Next Name and description of the notification.
+ also go to the subsection: "notifications" and choose the method how to notify you. --------------------------------------------

IMPORTANT:
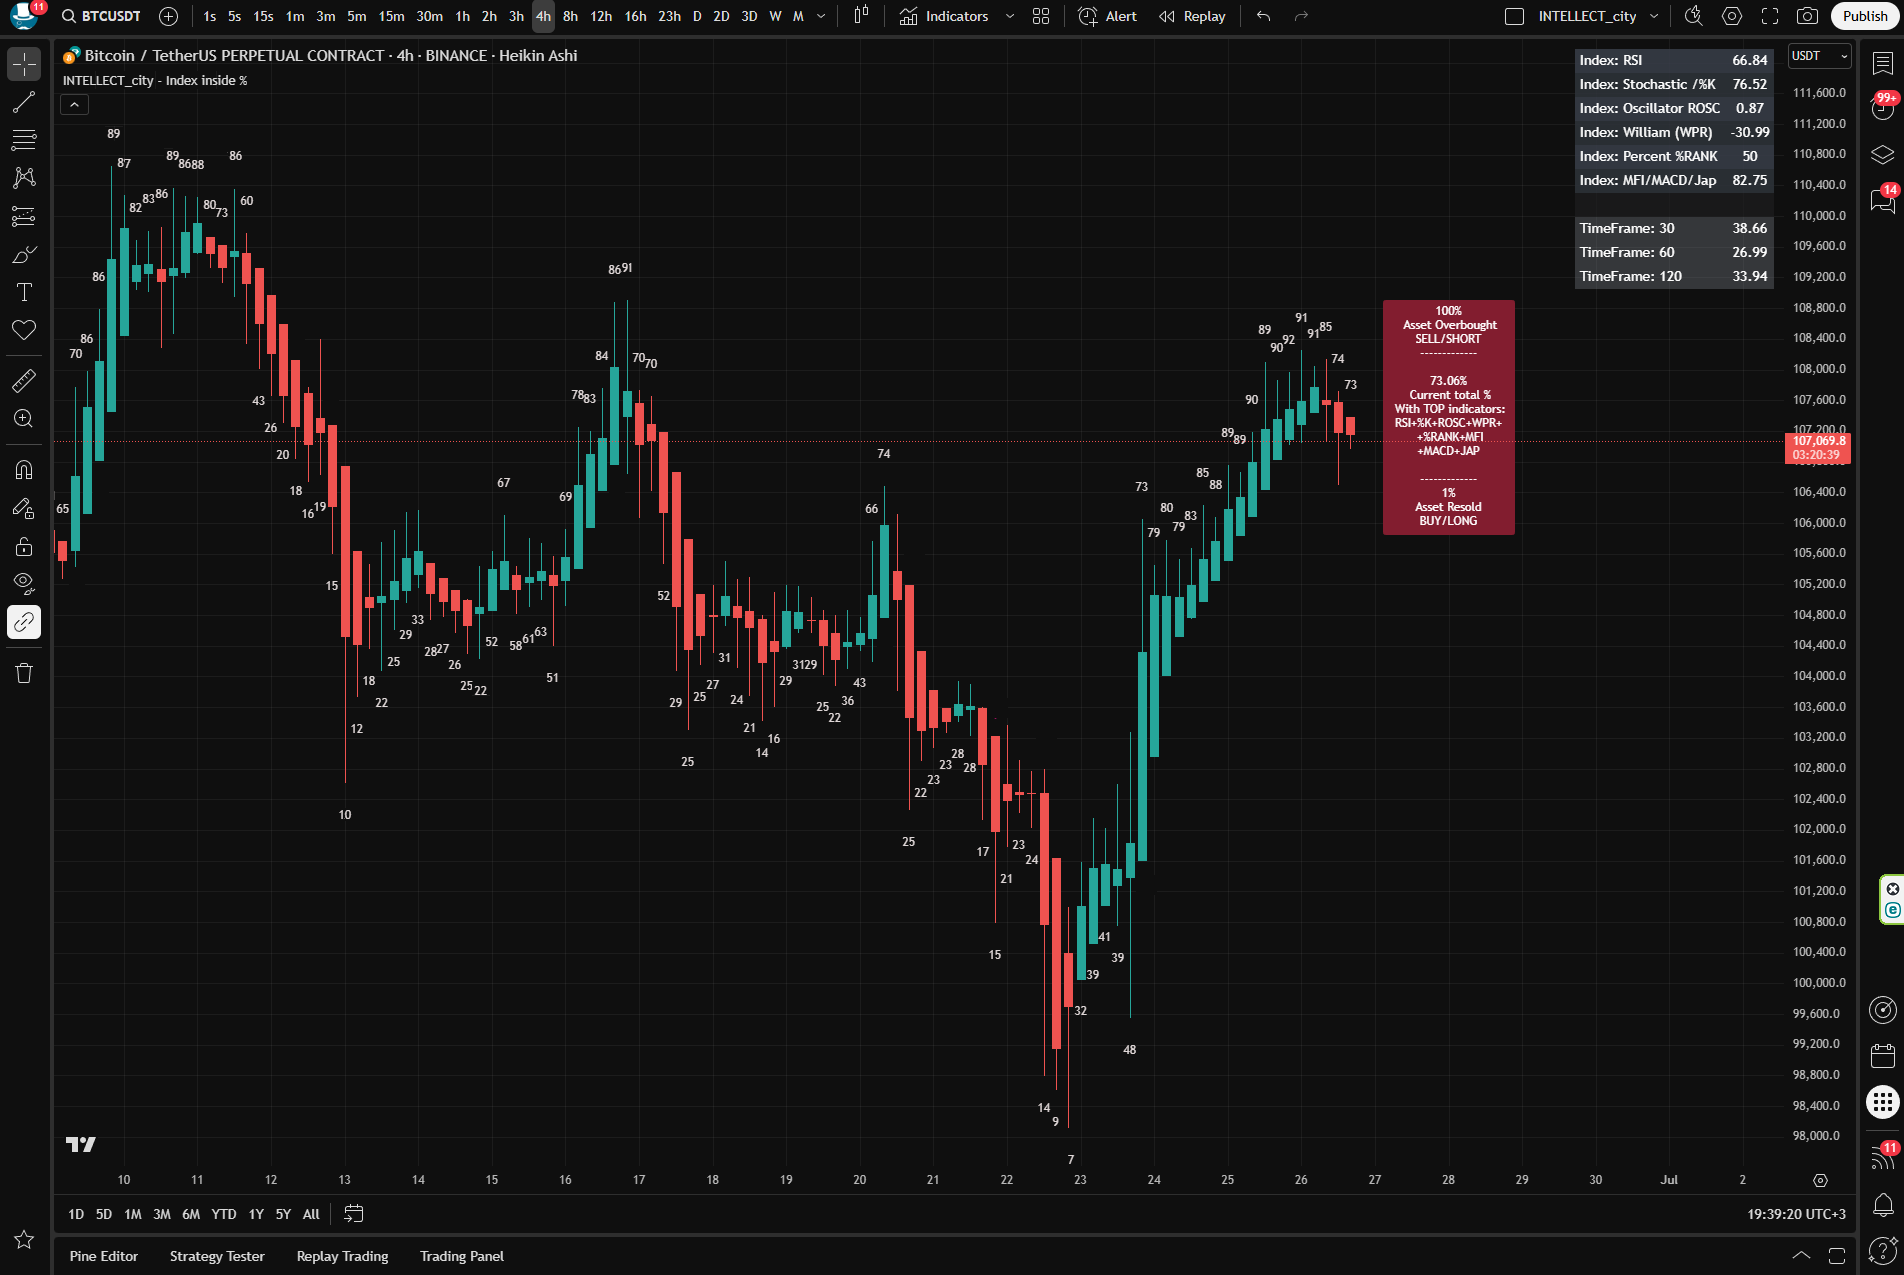
On the right side you can turn on/off the table where 4 timeframes are indicated.
For example, you are on the 4-hour, and at the same time you can look at 4 more timeframes that you specify.

In the settings you can specify the following parameters:

Minute and higher can only be specified in this format:
Where: '1' is 1m, '30' is 30m, '60' is 1h, '720' is 12h


Daily, and higher can only be specified in this format:
'D' is 1D, 'W' is 1W, 'M' is 1M

-------------------------------------------
Which candlesticks should I use?
Traders often use Heikin Ashi candlesticks (bars). To do this, right-click on the chart in the settings, select "Settings" --> "Tools" and check the box: Real prices on the price scale (instead of Heiken Ashi values).

How to enable Heiken Ashi on mobile - HERE
How to enable "Real prices on the price scale (instead of Heiken Ashi values)" on mobile HERE
or
How to enable Heiken Ashi on a PC (computer/browser) - HERE
How to enable "Real Prices on the Price Scale" (instead of "Heiken Ashi" values) on a PC (computer/browser) HERE
--------------------------------------------

PS: We recommend this indicator to all traders, it has shown excellent results over several years. Recommendation from the management of INTELLECT_city - this is the best indicator of the entire assembly.

Enjoy your trading!


Questions \ Hints \ Answers

When to do TP (Take profit? \ fix profit?)

You need to look at the opposite numbers from the entry point, for example:
If you found an entry point within 1-10% in Long, then you need to fix at approximately 80-100%.
You can not be greedy and fix the profit at 60% +- (It also depends on what kind of leverage you have, usually if you see 100% profit, fix it, we repeat, do not be greedy)
Also If you entered, for example, on a 2-hour time frame, and you have an excellent entry, you can look at the larger time frames in which range of percentages you are, if your entry point was on a 2-hour, for example, 1-10% and on the daily time frame there were also percentages in the range of 1-10%, then most likely it is better to look at the daily time frame and hold the position for a long time.
But remember the main rule of the trader: Always fix it, or unload in parts. See the profit, fix it. There are still hundreds of hundreds of entry points ahead, it is only a question of time and waiting for the right parameters.

You have many positions, how do you do it, please tell me the main principle?

The most important principle is to always split the Balance (margin) into many coins, the more the better. We personally split our Balance (margin) into 100 coins, yes, it's a lot, but we started with 10 coins.
The thing is that the market is unpredictable, and any algorithms cannot cope with this for an accurate entry, they can only suggest an entry zone, but it often happens that they suggest sniper-like.
But we still split the Balance (margin) into many coins to increase the chances.

Does this algorithm (indicator) work on stock pairs?

Yes, the indicators work on all pairs provided by Tradingview, both stock and crypto segments.
The Tradingview terminal provides correct data, and the indicators process it.
Initially, the algorithms (indicators) were written for the stock market, and they were transferred to the crypto segment.

Can you tell me what timeframes to use and explain a little individually how to enter a trade using the INTELLECT_city — index inside % algorithm?

By indicator: «INTELLECT_city — index inside %» We mainly look at the 2-hour timeframe, such a trade is a long trade, but the most optimal.

Here you have to take a closer look yourself, which timeframe is suitable. We mainly recommend 2 hours, but someone likes 1 hour, someone sees everything on 4 hours, someone scalps a little on 15 minutes, we sometimes wait for the indicators to be the same on medium, large, and most timeframes at the same time, for example: 2 hours and daily, if possible 3 days.

If you look globally, and this is very important, when the "Bullish market" you need to mainly look for entries in oversold, look for indicators that are at the bottom, and when the Bearish market you need to mainly look for positions in overbought at the tops.
Global Bullish and Bearish sentiment (trend) can be determined by our algorithm for Spot trading: "INTELLECT_city - World Cycle - ATH & ATL - 1D - Strategyy" You can find it in our Telegram in pinned messages - This is what concerns the global trend itself, and how to determine the global market sentiment.
VERY IMPORTANT is the following: We can determine even more interesting trend logic: this is the same algorithm "INTELLECT_city - index inside %"
You need to look initially at large timeframes "Daily" if possible 3-day. If the given timeframes show numbers of 90-95%, this means that the asset is globally overbought, which means you need to mainly "short", if the numbers are 9-12%, this means that the asset is oversold, which means you need to find positions in "long". After you have determined the trend, you need to switch to a local timeframe, for example, to 2-hour, and start from the indicators, if 9-12 (oversold) then "long", if 90%-95% (oversold) then "short". Locally, you can make several entries until Take Profit stops at the global trend numbers, that is: for example, you found an entry point at 8-12% on a 2-hour time frame, and at the same time on the “Daily” or “3-day” time frame, the indicators are now approximately 27%, which means that we still have room to grow to 90-95% and this means that we are mainly looking for longs.

In fact, it is very easy to determine the trend when there is a global algorithm "INTELLECT_city — index inside %" on the "Daily" or "3-day" timeframe, but you use a local one, for example, on a 2-hour timeframe, on the same algorithm "INTELLECT_city — index inside %"

How to enter a position, if you do not even look at the global "Daily" or, if possible, 3-day timeframe: If locally, for example, on a 2-hour timeframe, we mainly wait for 92-95%, we enter the position preferably in 3-5 attempts, dividing the entry into several parts (Sometimes there are even indicators of 86% or 92-95% for short, if for long we mainly wait for 9-12%), that is why it is proposed to make 3-5 parts of the entry, so that all the maximum or minimum percentages to cover, since it is impossible to know exactly the exact percentage, such does not exist in the world, but we determine the entry point of the average percentage of all TOP indicators of all TOP instruments in the world, which are used by all traders, and we calculate their average indicator, and have a privilege over everyone, since millions of traders use TOP oscillators: RSI + % K + ROSC + WPR + % RANK + MFI + MACD + JAP, and the algorithm is a percentage implementation of the histogram, the purpose of which is to reflect the market sentiment set by several normalized oscillators, and to give the average percentage of the entire market, where this average percentage determines overbought or oversold.


On percentages again: If the asset is oversold, find coins within 9-12%, if the asset is overbought, find coins within 90-95%. IMPORTANT: Everything depends on the time frame, the higher the time frame, the more difficult it is to find the lowest or highest indicators, the lower the time frame, the easier. Also, to strengthen what is what, read the description of the algorithm itself, the full description, above.

Can you briefly tell me what timeframes to use? in INTELLECT_city — index inside %

The ideal trade is:
So that the overbought or oversold numbers converge immediately on the timeframes: 2H + 1D +3D
+ You also need to watch the corresponding bands (zones) "Support\Resistance" from the indicator: "INTELLECT_city - Support and Resistance liquidity"
This is a top trade.

But, it is very difficult to find such a thing, and it takes a long time.
You have to improvise locally, but the combination above is a TOP trade.
Remember that trading is basically waiting for a good trade.

Also, from time to time, a 15-minute timeframe is suitable, both for scalping, or for small local trading.

What algorithms (indicators) does the INTELLECT_city team use?

Personally, we mainly use only 3 indicators:
«INTELLECT_city — index inside %»
«INTELLECT_city - 8 in 1 Support Indicators»
«INTELLECT_city - Liquidation Map - Market Maker»

We just switch the others sometimes.

How do trades happen on a YouTube stream?

Behind the scenes on the stream: We trade as a team.
Each team member is in different parts of the world, we try to saddle 24 hours a day so that someone constantly controls the trade. We take turns passing the helm of control.
Mr_GooD (INTELLECT_city) mainly directs and adjusts positions.
Also + Powerful servers have been installed so that the stream is 24/7, calculated at least for several years in advance. INTELLECT_city Began its open activity in 2018.

Do you give signals?

We do not give signals, do not provide VIP channels, do not do trainings, do not sell courses, etc., since we do not have time for this. We have been trading since 2018 on Spot and Futures (derivatives), Streaming is created exclusively to get feedback, find shortcomings, or suggest changes. For the long existence of streaming and participants who use algorithms, the feedback is really decent, that as a result, all updates are received immediately as soon as any algorithm is updated automatically.
IMPORTANT: in the description under the stream there is a warning that it is forbidden to repeat after us, since without indicators (algorithms) it is very difficult, and the whole picture is not visible. Also IMPORTANT: most of other people's VIP channels, we know that they buy algorithms from us and sell you these signals, or use them in their bots, or copy trading.

IMPORTANT: additional algorithms include "Screener" (Automatic Bot that searches for the most volatile coins) The link to the channel can be found under each message in Telegram. The channel is private and free.

What is the difference between the packages? and do they need to be configured?

In all Basic \ Pro \ Expert packages

The same indicators are issued, the only difference is in time.

Also, all algorithms (indicators) do not need to be configured, all default settings are already configured.

Is there an automatic trading or a Bot?

Yes, automatic trading works, but we don't have Bots, for understanding, everyone connects our algorithms (indicators), a kind of brain, to any bot.

Everything you see on the stream is ready-to-use indicators, they can also trade automatically through Tradingview, but we try to do everything manually, because we have tremendous experience, and human control is much better than automatic.
If you are still interested in automatic trading, our indicators can do it, through notification on Tradingview, and connected WebHook (which you can request how to connect, provided that you are our client) and all algorithms (indicators) will be able to trade automatically.

Do I need to pay anything extra on Trdingview to make your algorithms (indicators) work?

You don't need to pay anything on the Trdingview platform to make our algorithms (indicators) work.
This is if you want to expand the functionality of Tradingview itself, for example, a second timeframe, increase the number of indicators on the chart, more notifications, WebHook connections, etc...
WebHook is needed for automatic trading using notifications.

Can algorithms (indicators) be used in SPOT trading?

Excellent question, yes, they were originally created for this, but everyone is interested in Futures these days.
Yes, they are applicable both to Spot trading and to Futures (Derivatives)
Our main specialization is SPOT trading, which can be viewed in the telegram channel, our open portfolio since December 16, 2018.
Also, we strongly recommend that everyone only engage in Spot trading in Hold.

What candles (Bars) to use?

Traders often use Heikin Ashi candlesticks (bars). To do this, right-click on the chart in the settings, select "Settings" --> "Tools" and check the box: Real prices on the price scale (instead of Heiken Ashi values).

How to enable Heiken Ashi on mobile - HERE
How to enable "Real prices on the price scale (instead of Heiken Ashi values)" on mobile HERE
or
How to enable Heiken Ashi on a PC (computer/browser) - HERE
How to enable "Real Prices on the Price Scale" (instead of "Heiken Ashi" values) on a PC (computer/browser) HERE

To make a profit:

Need mobility

Indicators are always with you, in your pocket, on your mobile, PC, laptop.
Are you relaxing on the beach? Everything is at hand. Are you at a restaurant? Mobile with algorithms in your pocket. Are you on the road in a car? Everything is at hand.

Time = Money

Algorithms must work 24/7, when you are resting or sleeping - Indicators must work for you, the market is huge, and the human factor is not able to take into account all aspects related to the cryptocurrency world.

Fomo

Each of us has human FOMO (Fear of Missing Out), greed, euphoria, panic, and because of this we often make mistakes in trading. We need cold calculation, robotism, and unemotional decision making.

INTELLECT_city indicators are already used:

Approximate statistics for the last 7 years, the use of our algorithms and indicators:

1238 +
Users
97234 +
Auto alerts
684 +
Connected Exchanges
    

All our indicators
algorithms are located on the TradingView platform

Which is powerful and fast. TradingView always comes with advanced settings and the interface you know and love.

Trade Bitcoin and all Altcoins

Trading on Bitcoin will never be enough for you; we know that you always want more.
Perfectly! The indicators are also suitable for trading Bitcoin and all Altcoins.
What about the Timeframe? Yes, they are suitable for any timeframe, including all trading exchanges.

Professional advice for traders: The higher the timeframe, the more confident the position, but each trade will then take longer.

Remember: Time multiplied by price = profit.

shade_image
shade_image
shade_image
shade_image
shade_image
shade_image
shade_image
shade_image
shade_image
shade_image

For real success

Your favorite trading requires a professional tool. Only with the best algorithms can you achieve outstanding results. They are the ones who will make your trading effective and profitable.