Indicators Algorithms INTELLECT.city

Trade anywhere, anytime! Algorithms in your pocket make trading mobile, helping you increase your income.

INTELLECT_city - Liquidation Map - Market Maker


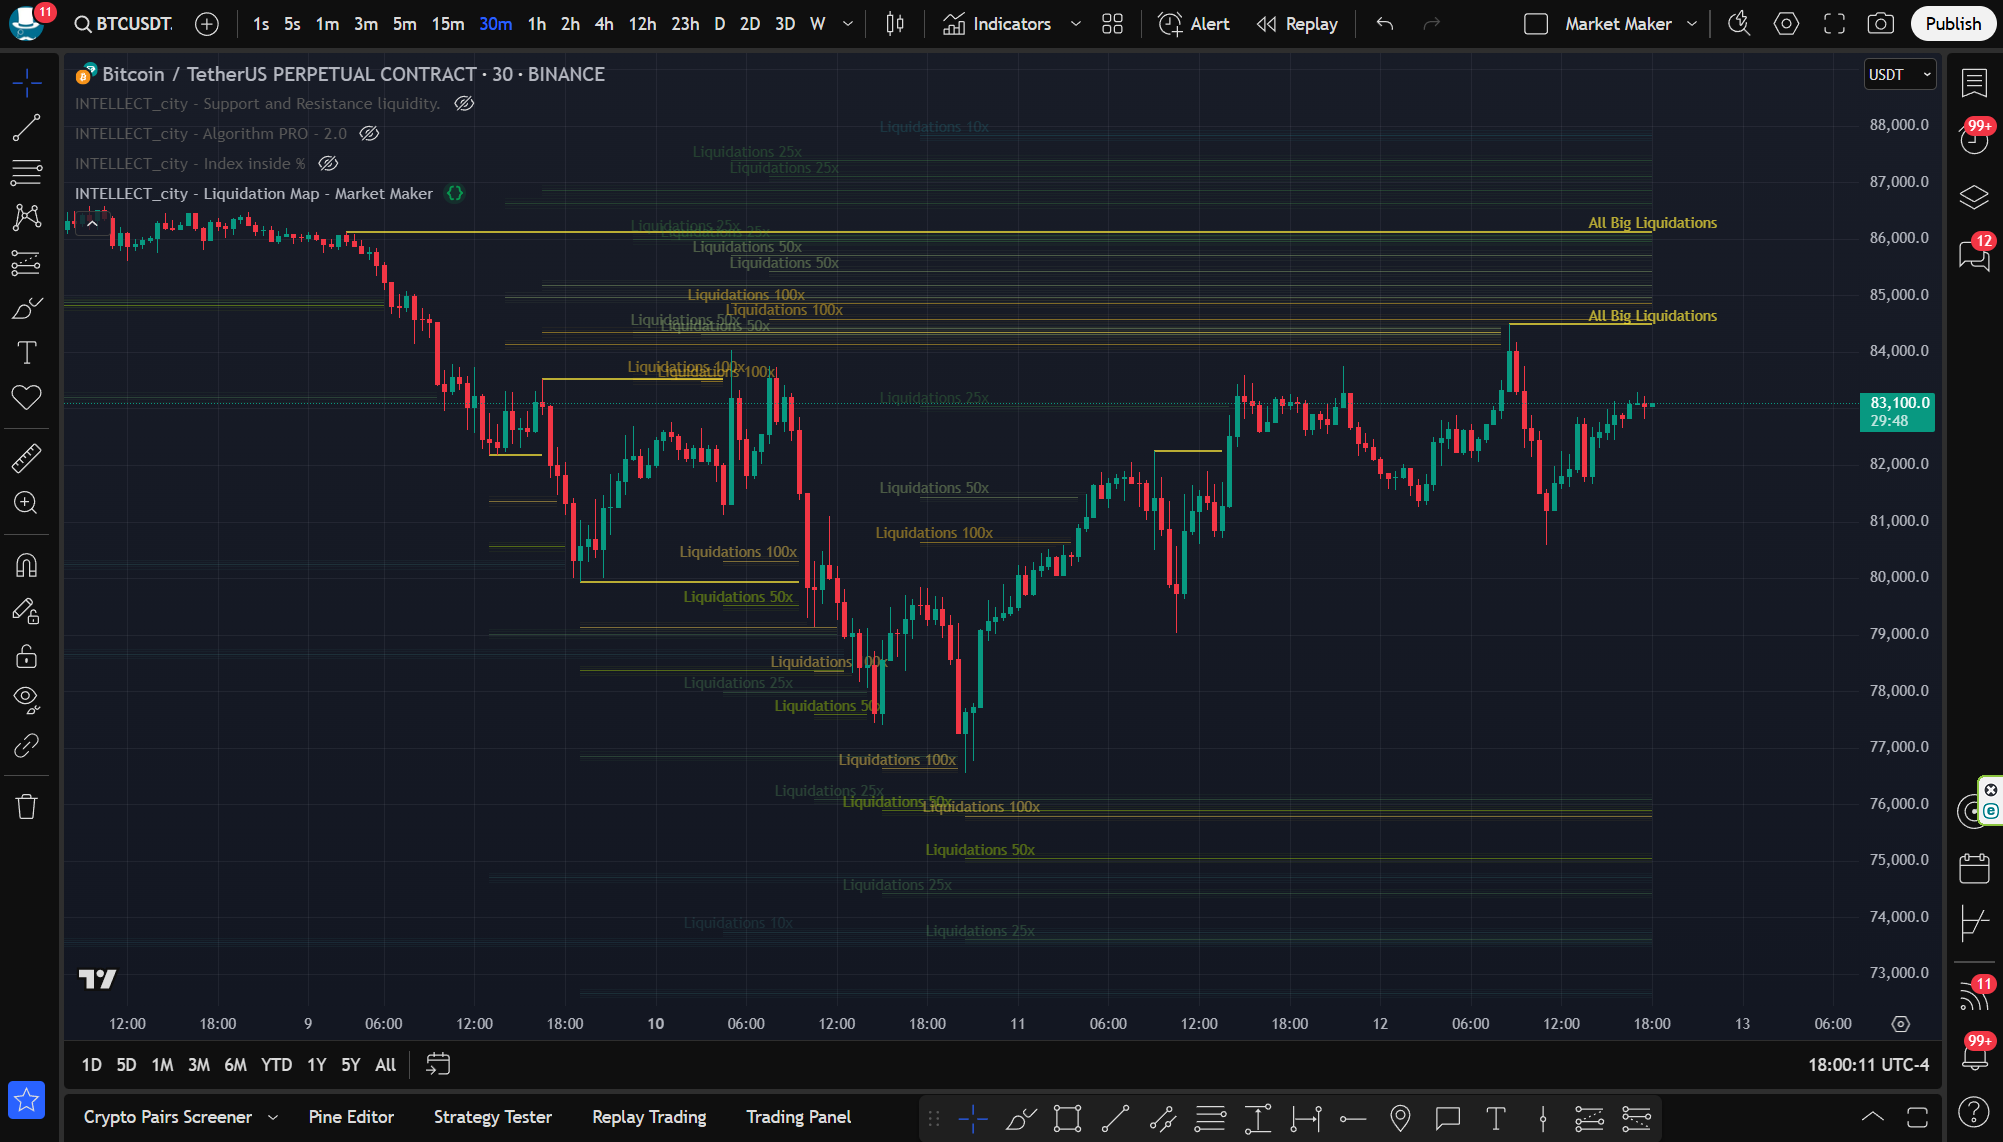
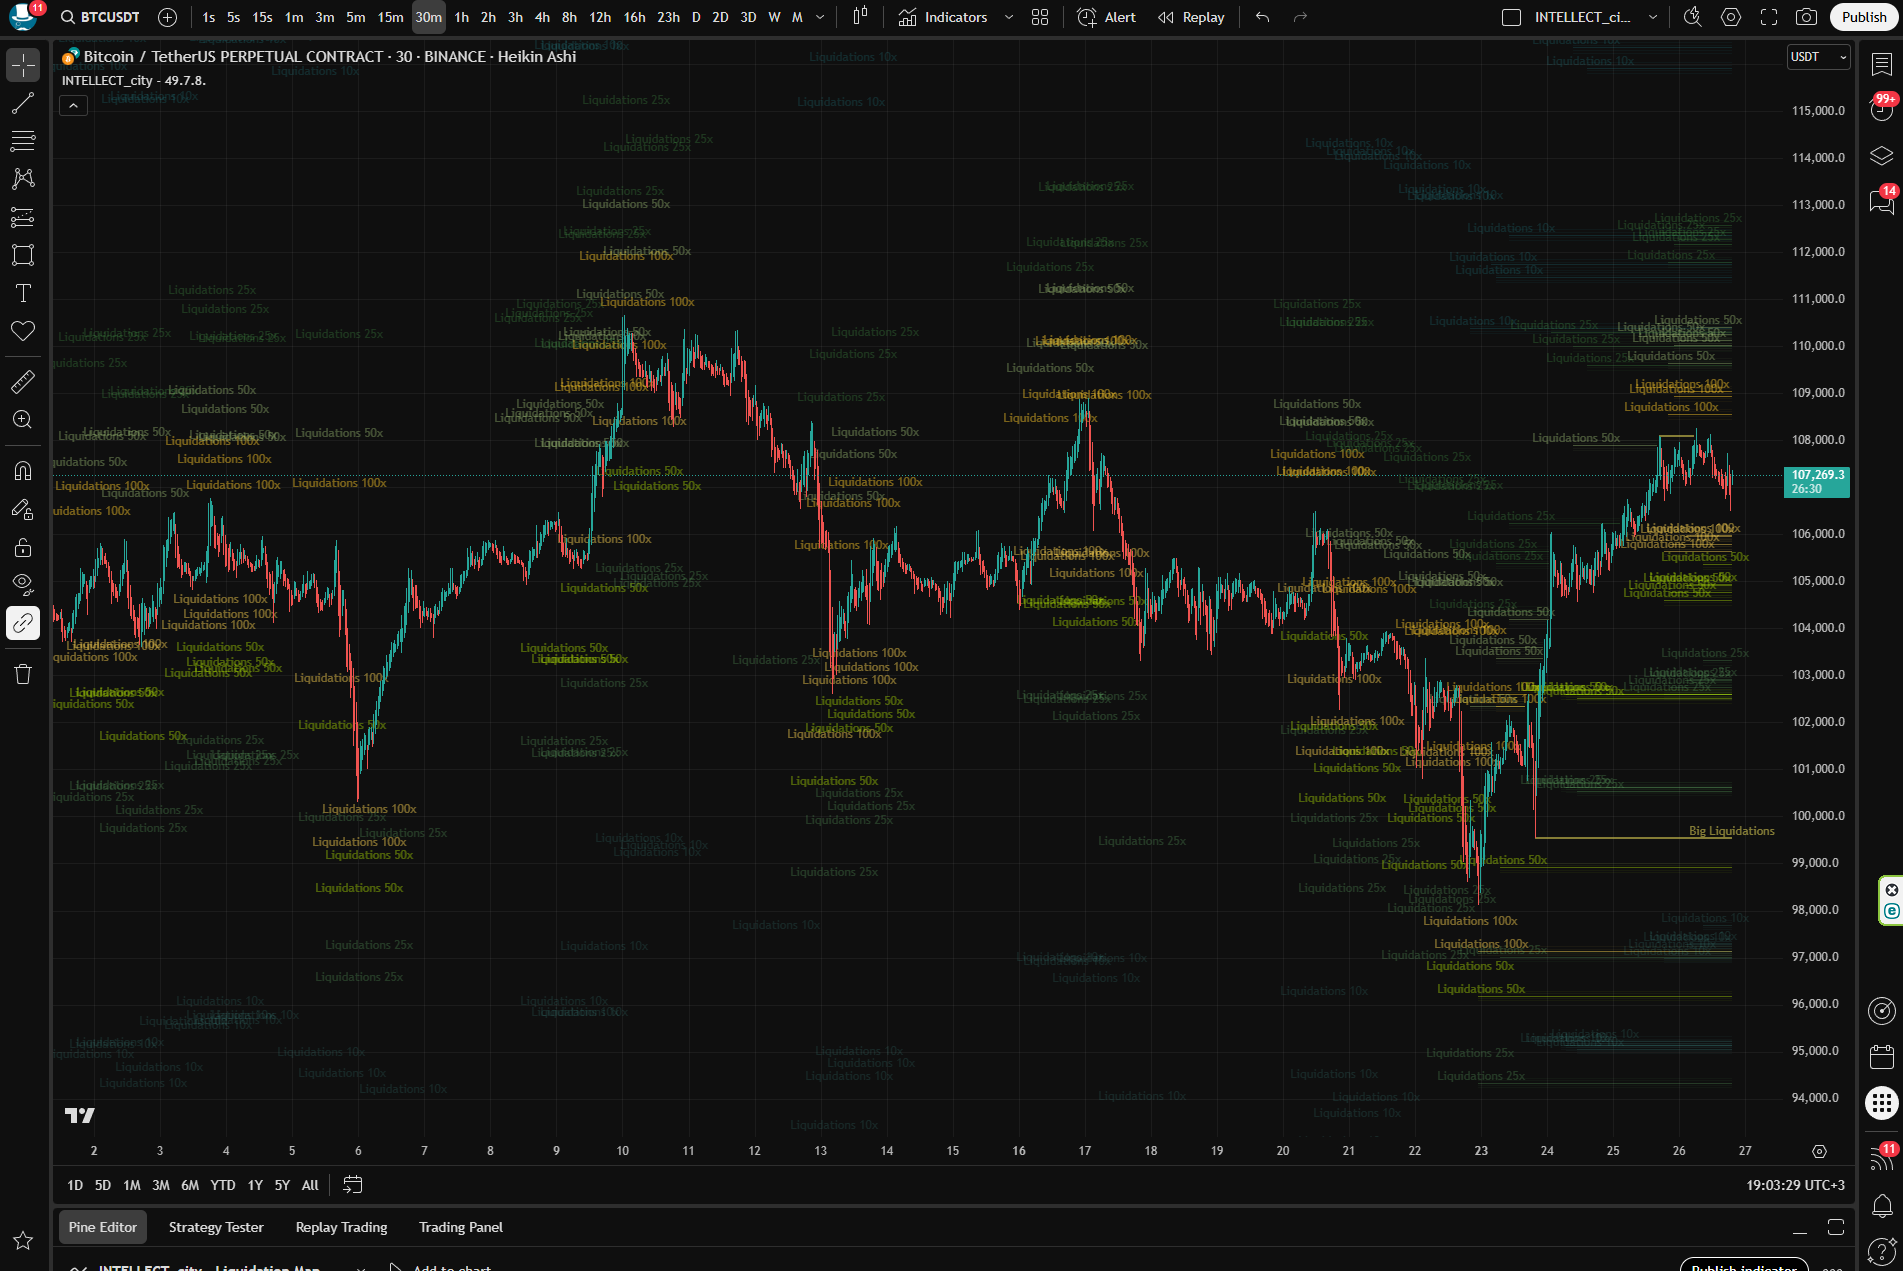
INTELLECT_city - Liquidation Map - Market Maker — Liquidation Map.

The Liquidation Map predicts the price levels at which large liquidation events are likely to occur.
Market Maker (its algorithm always moves the price in the direction of the largest number of liquidations, so that exchanges can get the best possible profit. In turn, thanks to this algorithm, we can see further events and be one step ahead of traders.


A liquidation event occurs when a trader's positions are closed due to price fluctuations, and his margin account balance is insufficient to cover open positions. To prevent further losses for both traders and exchanges, most exchanges offer a liquidation level, which is the price at which leveraged trades will be forcibly closed.

Traders who can estimate the liquidation levels of other traders can gain an advantage similar to understanding high liquidity in the order book. The Liquidation Map from INTELLECT_city attempts to predict where large liquidations are likely to occur, to help traders find better positions. liquidity.

The Liquidation Map calculates liquidation levels based on market data and various amounts of leverage. The calculated levels are then added to the prices on the chart.

As more estimated liquidation levels are added to a given price, the colors on the heat map change. The color range goes from purple to yellow, with yellow representing a large number of estimated liquidation levels, allowing traders to identify areas of high liquidity.

The Liquidation Map predicts where liquidation levels are likely to start, but not where they will stop. Therefore, the actual number of liquidations will be lower. When considering the size, it should be considered as a relative figure, compared to other levels. Users can filter by multiple major exchanges, trading pairs, and historical liquidation data.


How Traders Can Use It:

The Liquidation Heat Map allows traders to identify areas of high liquidity, which can be useful for a number of reasons:

Magnet Zone: A concentration of potential liquidation levels in a certain price range can indicate that the price is likely to move in the direction of this zone. Some traders use these liquidation levels to assess the possible direction of price movement and as additional indicators of convergence.

Support/Resistance Zone: In high liquidation zones, large traders or “whales” can quickly enter trades at favorable prices. Once they enter or exit orders within this liquidity, the price can reverse.

Furthermore, liquidation levels can exert significant pressure on both the buy and sell sides of the order book, causing a natural price reversal.

Liquidations play an important role in the cryptocurrency market as they have a significant impact on traders’ positions. By understanding how to use the data from the liquidation heat map, traders can make informed trading decisions and potentially increase their chances of success.

Questions \ Hints \ Answers

Which time frame is preferable?

It is recommended to use the 30 minute timeframe on Tradingview, it takes data from "1 Week" 1 weekly timeframe.
You can also use all other timeframes, but keep in mind that the algorithm has significant functions built in that take data from "1 Week" (1 weekly timeframe), since Tradingview provides data from exchanges in a different formula.

Timeframe comparisons from Exchanges for Tradingview:

- Exchange data "24 hour" - then on Tradingview it is "5 minute" timeframe.

- Exchange data "1 Week" - then on Tradingview it is "30 minute" timeframe. (Recommends)

- Exchange data "1 Month" - then on Tradingview it is "2 hour" timeframe.

- Exchange data "1 Year" - then on Tradingview it is "1 day" timeframe.

Is it possible to scalp on a second or minute timeframe?

You can also use all timeframes, including even second or minute ones, if the choice between them is then minute, but it is all at your discretion. The 30-minute timeframe is recommended (it takes data from a 1-week timeframe)

What candles (Bars) to use?

It is best to use regular candles for private trading.
"Japanese candles" (Candles)

Traders sometimes use Heikin Ashi candles (bars) then in the settings, right-click on the chart "Settings" Section "Tools" and check the box: Real prices on the price scale (instead of Heikin Ashi values)

Which pairs to use?

The algorithm works on all pairs, exchanges that Tradingview provides, both stock and crypto segments, the Tradingview terminal provides correct data, and the indicators (algorithm) processes them.

Important to know:

The algorithm was mainly developed on pairs BTC/USDT, ETH/USDT, BNB/USDT, XRP/USDT, ADA/USDT, SOL/USDT, DOT/USDT - up to the maximum leverage, and the main leverage is x100, and if you switch the algorithm to other pairs that have less leverage, the algorithm will also show x100 leverage, but if the pair on the exchange has a maximum leverage, for example, x20, then take into account the indicators on the Tradingview chart only up to x20 leverage and the main yellow line "All Big Liquidation" (Translated: All big liquidations)
As soon as Tradingview has the ability to adjust to each pair with certain leverage, we will correct the algorithm so that it displays on all pairs up to a certain leverage, which is specified on the pair you connected and the exchange, we will immediately notify you by making an automatic update. The fact that it displays all the shoulders on the chart is not a big deal, just mainly pay attention to the maximum shoulders that are on your connected pair.

To make a profit:

Need mobility

Indicators are always with you, in your pocket, on your mobile, PC, laptop.
Are you relaxing on the beach? Everything is at hand. Are you at a restaurant? Mobile with algorithms in your pocket. Are you on the road in a car? Everything is at hand.

Time = Money

Algorithms must work 24/7, when you are resting or sleeping - Indicators must work for you, the market is huge, and the human factor is not able to take into account all aspects related to the cryptocurrency world.

Fomo

Each of us has human FOMO (Fear of Missing Out), greed, euphoria, panic, and because of this we often make mistakes in trading. We need cold calculation, robotism, and unemotional decision making.

INTELLECT_city indicators are already used:

Approximate statistics for the last 7 years, the use of our algorithms and indicators:

1238 +
Users
97234 +
Auto alerts
684 +
Connected Exchanges
    

All our indicators
algorithms are located on the TradingView platform

Which is powerful and fast. TradingView always comes with advanced settings and the interface you know and love.

Trade Bitcoin and all Altcoins

Trading on Bitcoin will never be enough for you; we know that you always want more.
Perfectly! The indicators are also suitable for trading Bitcoin and all Altcoins.
What about the Timeframe? Yes, they are suitable for any timeframe, including all trading exchanges.

Professional advice for traders: The higher the timeframe, the more confident the position, but each trade will then take longer.

Remember: Time multiplied by price = profit.

shade_image
shade_image
shade_image
shade_image
shade_image
shade_image
shade_image
shade_image
shade_image
shade_image

For real success

Your favorite trading requires a professional tool. Only with the best algorithms can you achieve outstanding results. They are the ones who will make your trading effective and profitable.