
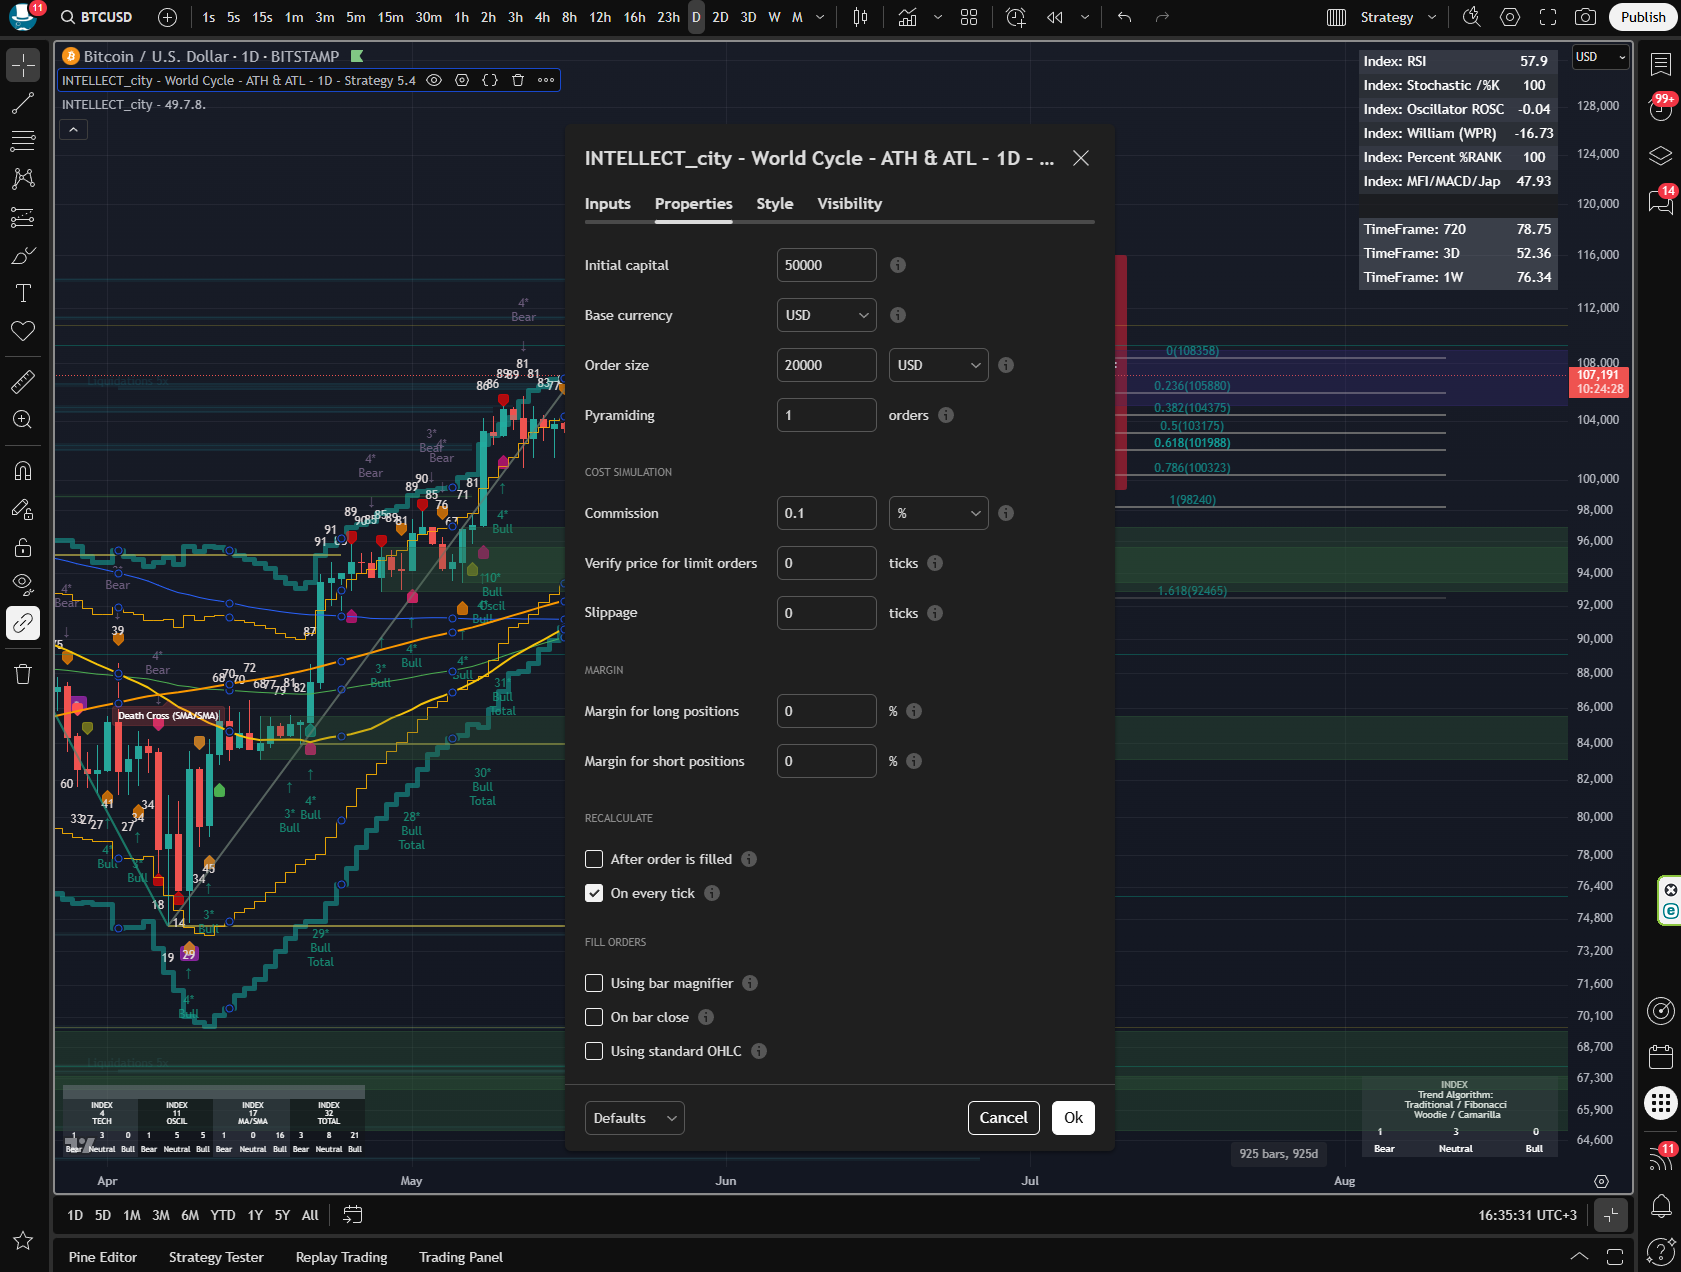
The algorithm is automatic, suitable for long-term trading, for those who hold a portfolio and want to know when to buy, when to sell at maximum ATH (peaks) or ATL (bottom) prices, in order to get the greatest possible profit, without unnecessary movements.
The algorithm is suitable for both Swing trading, long trading, Intraday trading, HODL\HOLD trading.
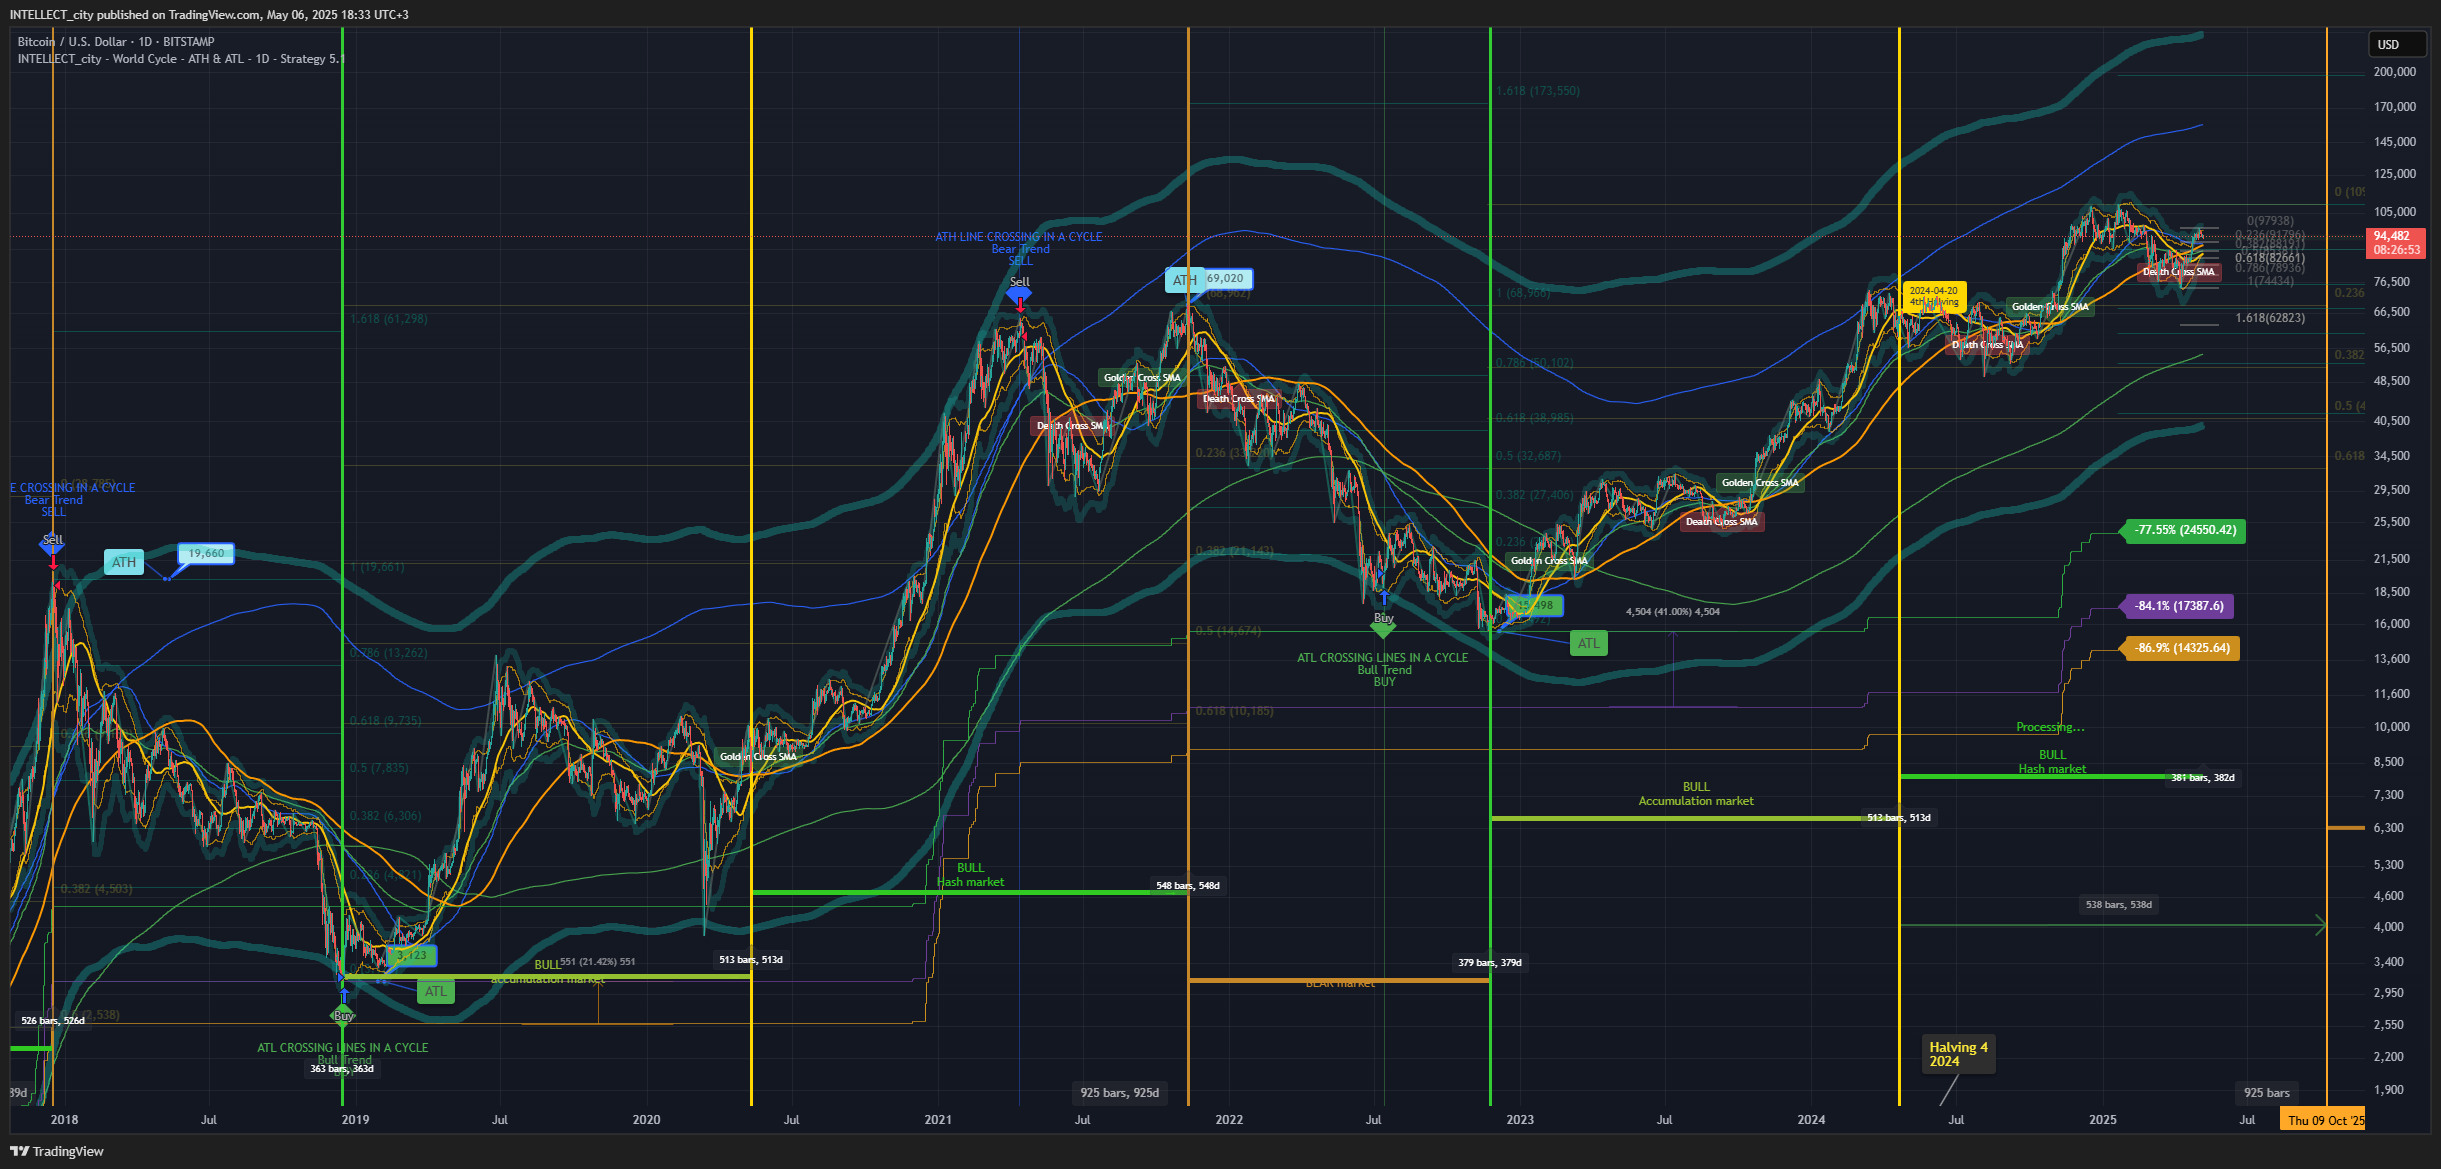
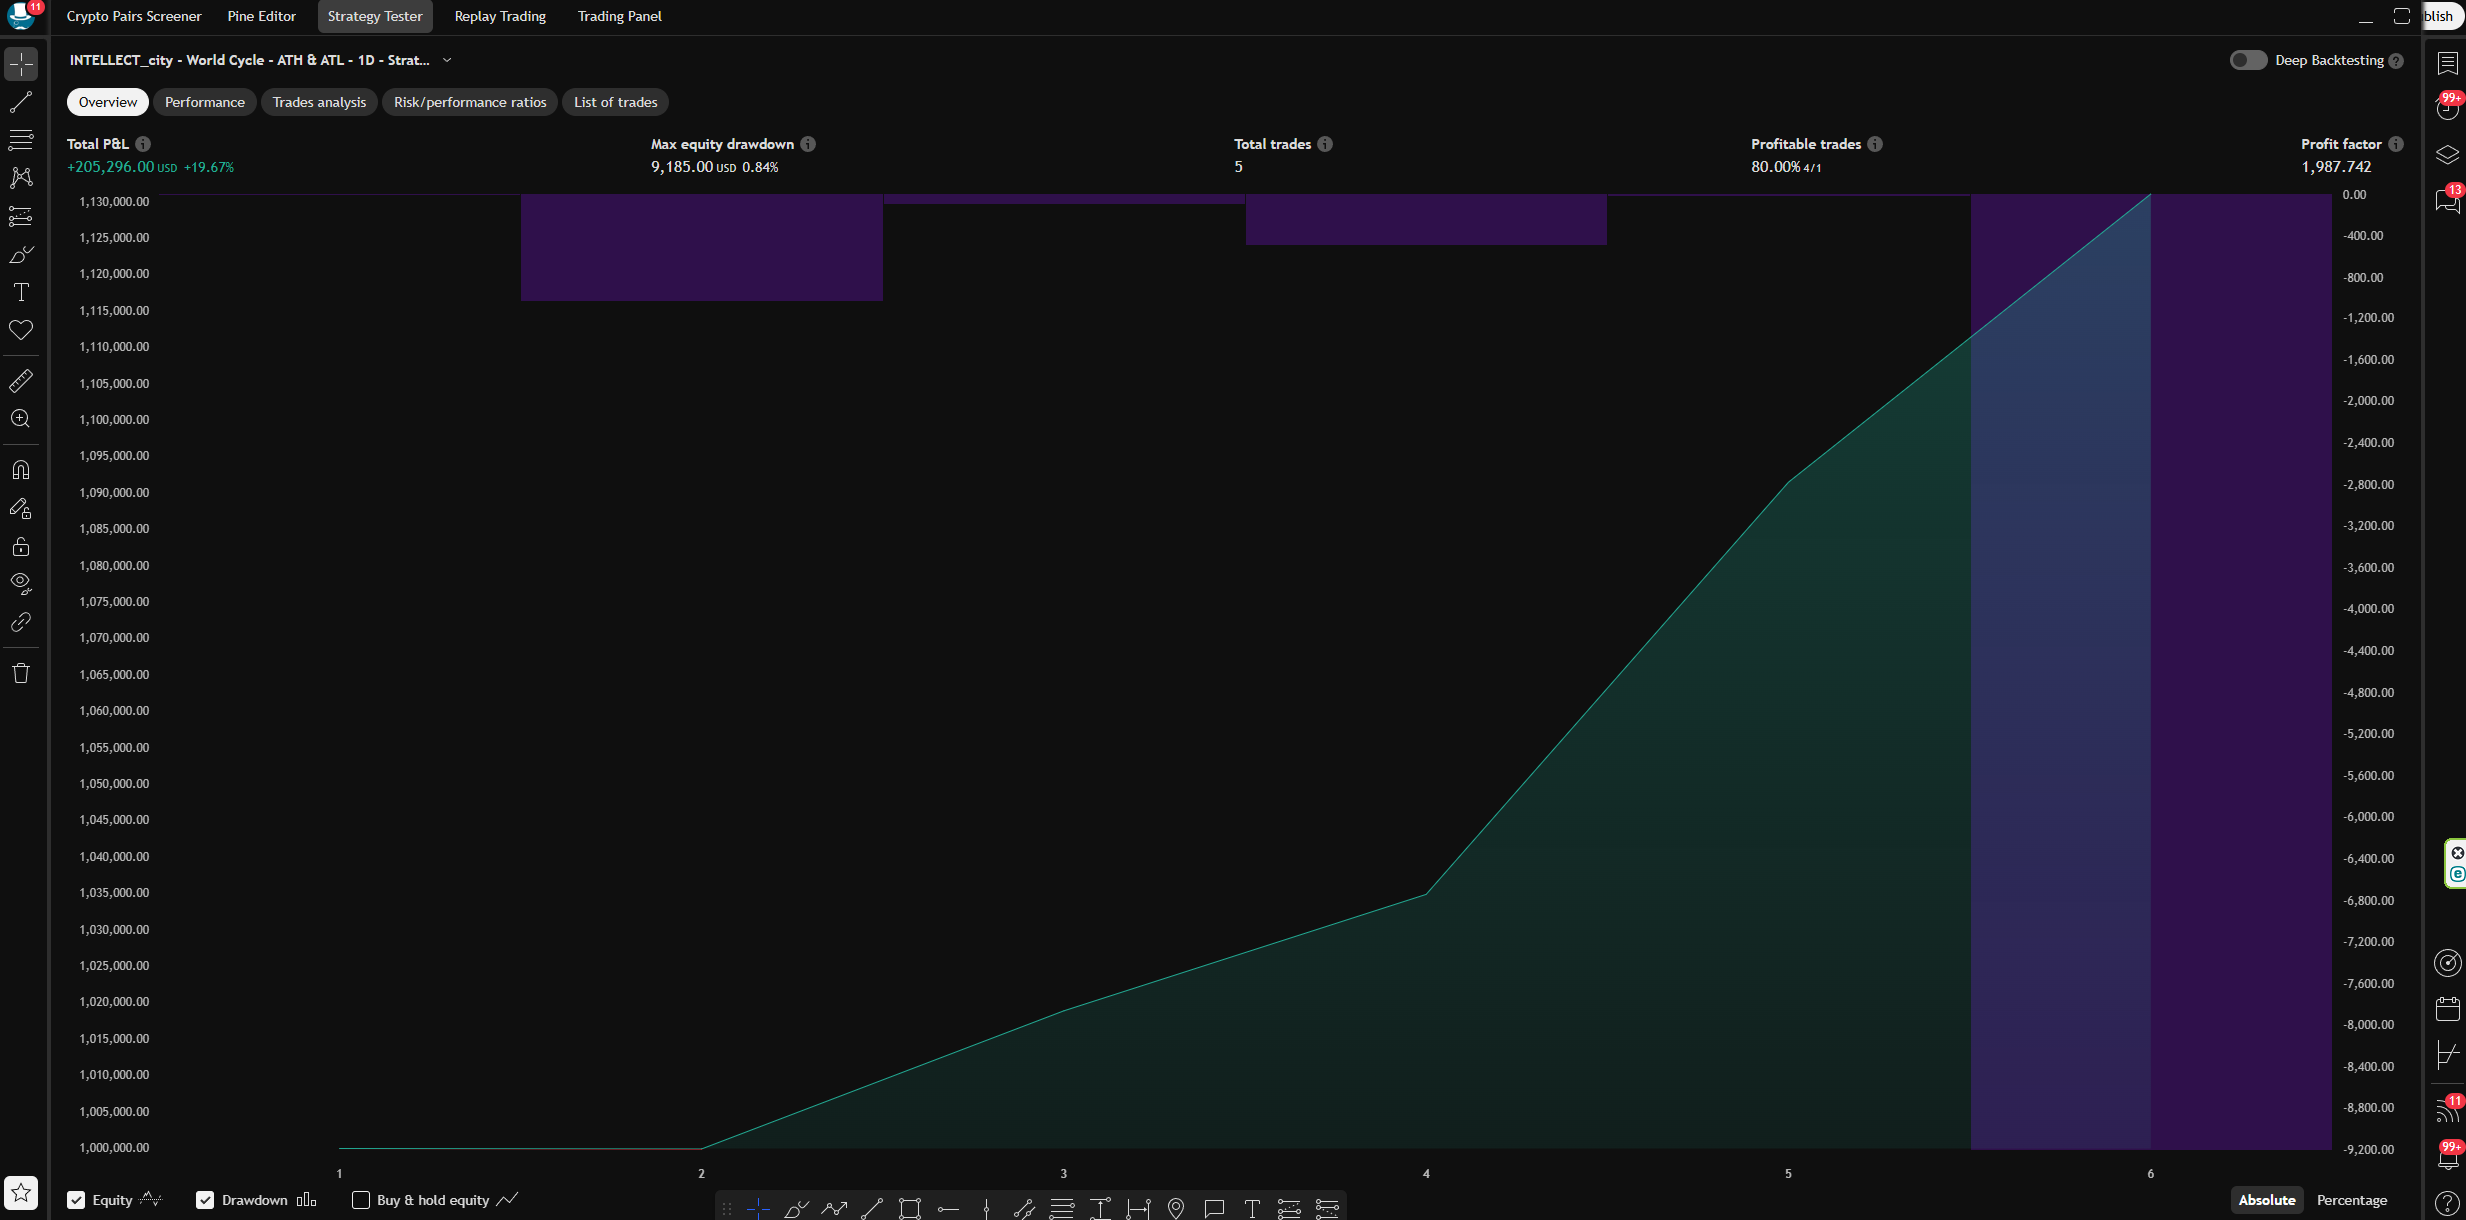
The main algorithm that shows the strategy:
INTELLECT_city - World Cycle - ATH & ATL - 1D - Strategy
This is a logarithmic signal, the Pi Cycle Top and Bottom Oscillator is an adaptation of the original Pi Cycle Top chart. It compares the circle of the 111-day moving average and the circle of 2 * 350-day moving average of the Bitcoin price. These two moving averages were chosen as 350/111 = 3.153; Approximation of the important mathematical number Pi.
When do signals appear in the strategy to buy/sell?
In order to make it easier to understand, and not to delve into the formula, special thin lines were made: "Blue" and "Green"
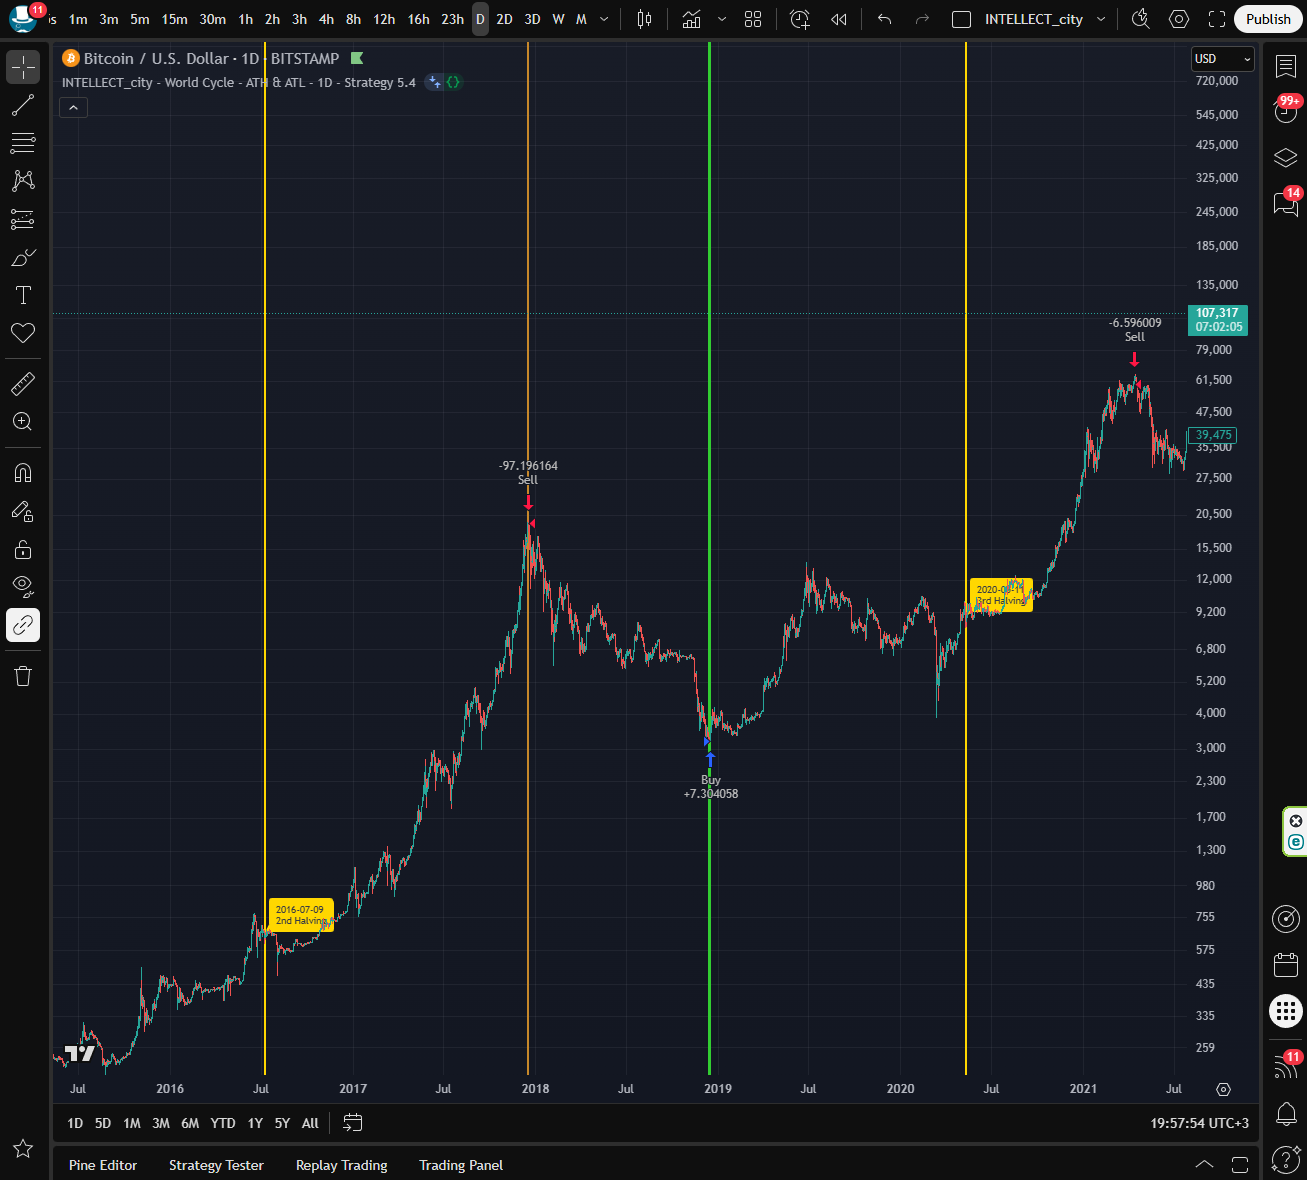
- When the blue lines intersect, this is the location of the ATH (price top) for sale in the cycle from Halving to Halving.
- When the green lines intersect, this is the location of the ATL (price bottom) for purchase in the cycle from Halving to Halving.
View the history of how and when they intersect and you will understand how accurately it finds ATH (Price Top) or ATL (Price Bottom)
IMPORTANT: Basically, to get ATH or ATL there must be the first intersection in the cycle from Halving to Halving.
IMPORTANT: Blue and green lines are the formula for the mathematical number Pi, to make it easier to understand the process of finding ATH or ATL.
CONDITIONS of using the indicator:
- You need to enable the pair: BTC\USD (Without T at the end)
- Exchange: Bitstamp (Big history)
- Timeframe: 1 day (The algorithm works only on this Timeframe, since the trade is long-term)
- Enable "Logarithmic" on the chart (enabled on the chart in the browser, click the "L" button at the bottom right) or on a mobile phone: look for the "Gear" on the chart and switch to "Logarithmic"
-------------
Additional interaction with algorithms in this strategy:
INTELLECT_city - Halvings Bitcoin Cycle
Shows Halving dates events, both all previous and all future in the current bars. Well oriented and shows what cycle is now, and what usually happens after "Halving".
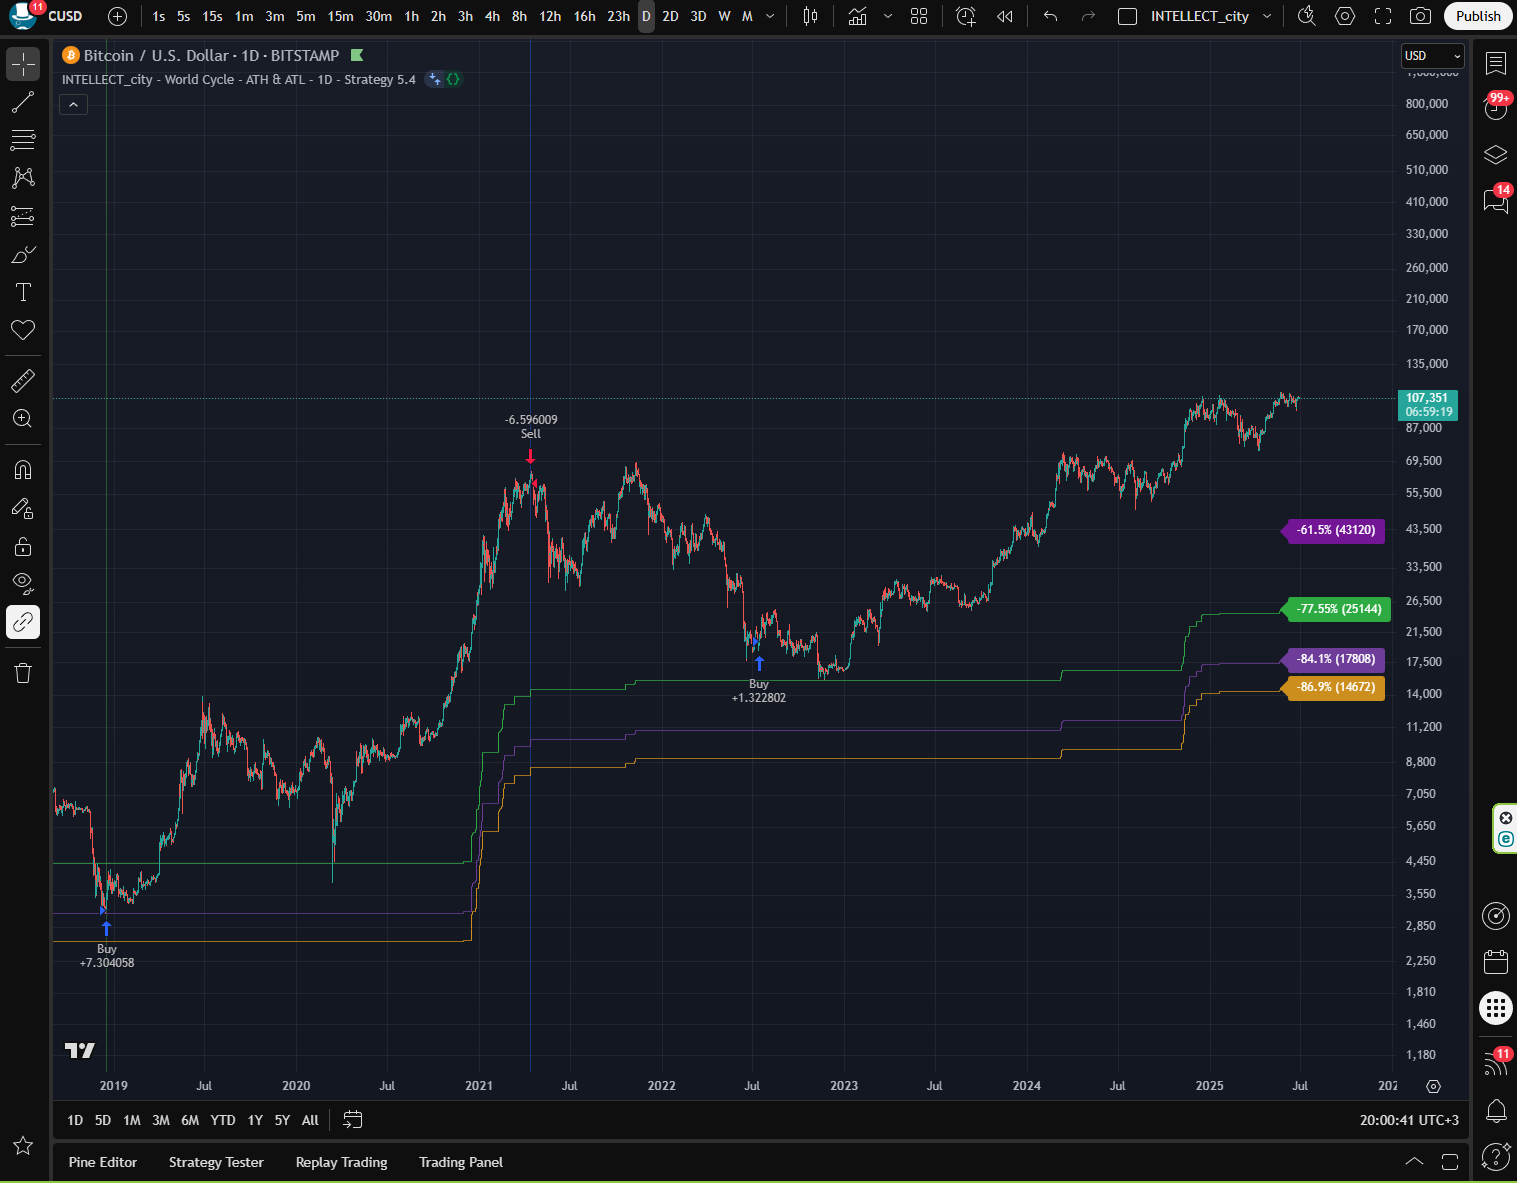
INTELLECT_city - Retracement % ATH
Shows in percentage terms how many percent of ATH (%) You can specify any at your discretion. From this algorithm, you can very easily calculate the bottom of the price of the entire cycle, or how much the price has dropped, in order to understand in what range to buy an asset, based on old indicators.
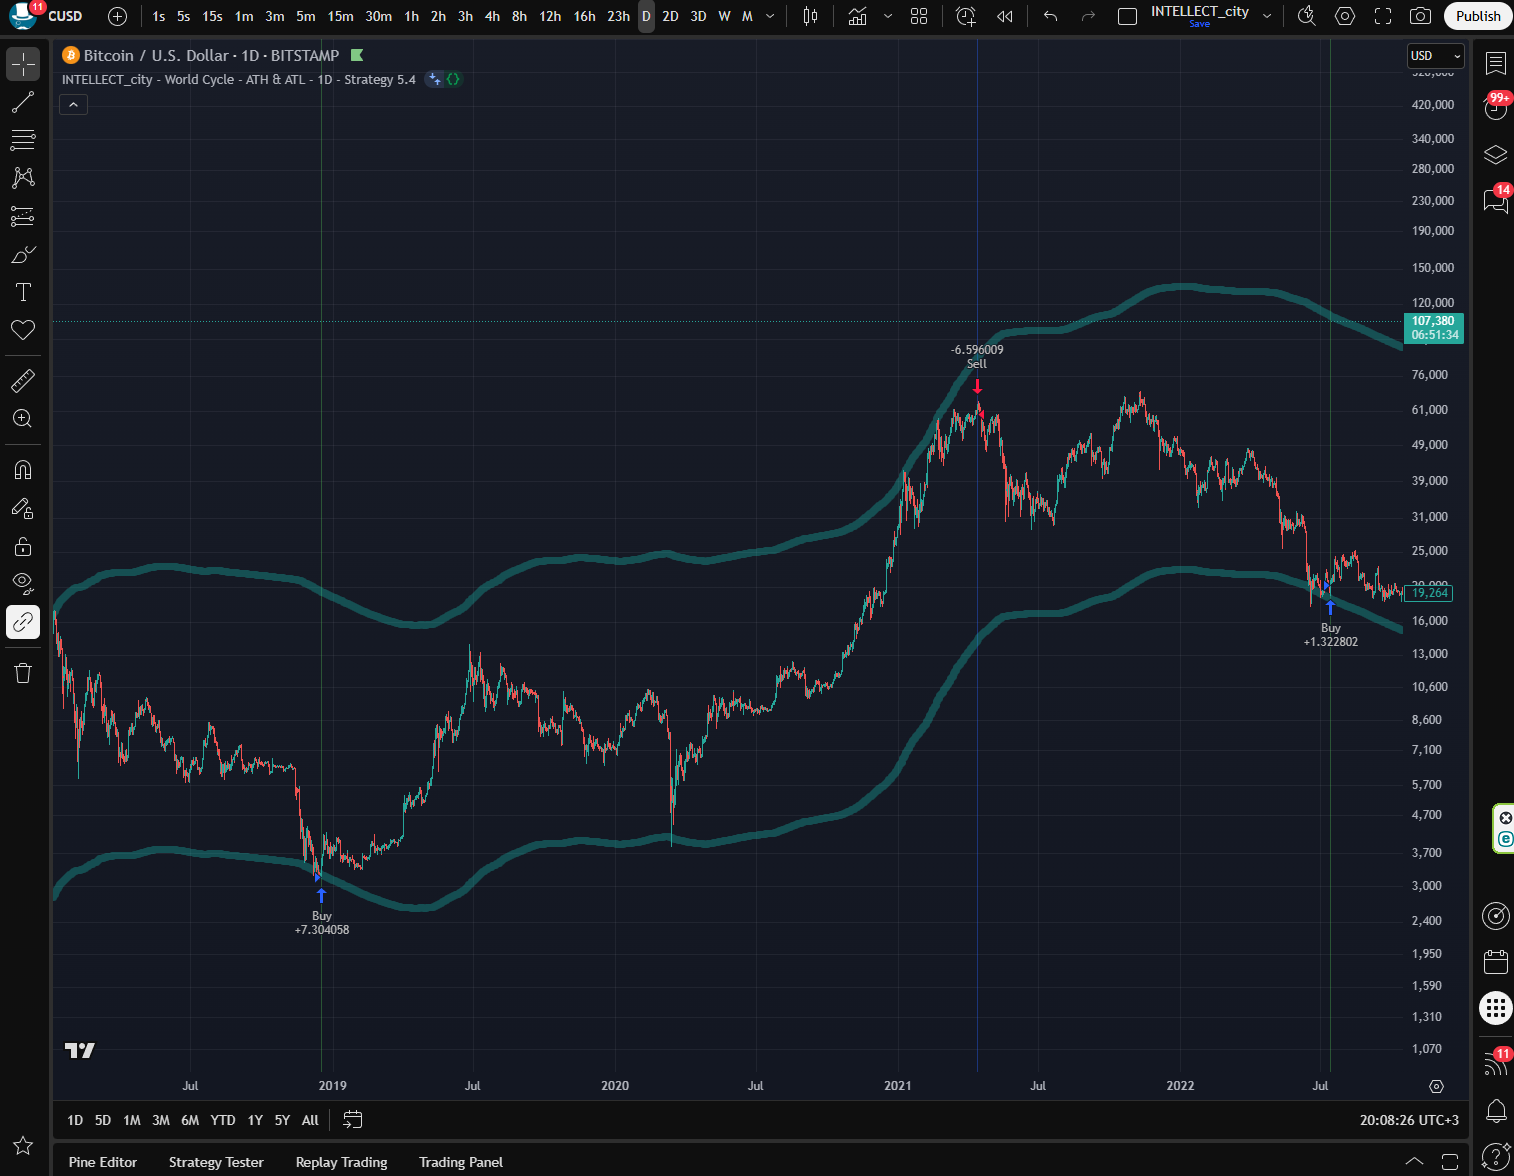
INTELLECT_city - ATH and ATL Price Global
The algorithm shifts the moving average with a period of Global 350 days, which is shifted in time (forward or backward) to analyze long-term trends, support/resistance levels and entry/exit signals.
Algorithm: Excellent filters long-term trends, ignoring short-term noise. Works as a dynamic support/resistance in trending markets.
INTELLECT_city - ATR Local ATH-ATL
This algorithm builds an exponential moving average (EMA) with a period of 22 days and three ATR (Average True Range) levels (±1, ±2, ±3) around it with a period of 13 days. It helps to determine local highs/lows and volatility zones to find entry/exit points.
The algorithm visualizes volatility zones (±1, ±2, ±3 ATR) to accurately determine support/resistance levels.
Flexibly customizable: you can turn on/off EMA and ATR levels.
Ideal for trending and volatile markets, helping to catch reversals or breakouts.

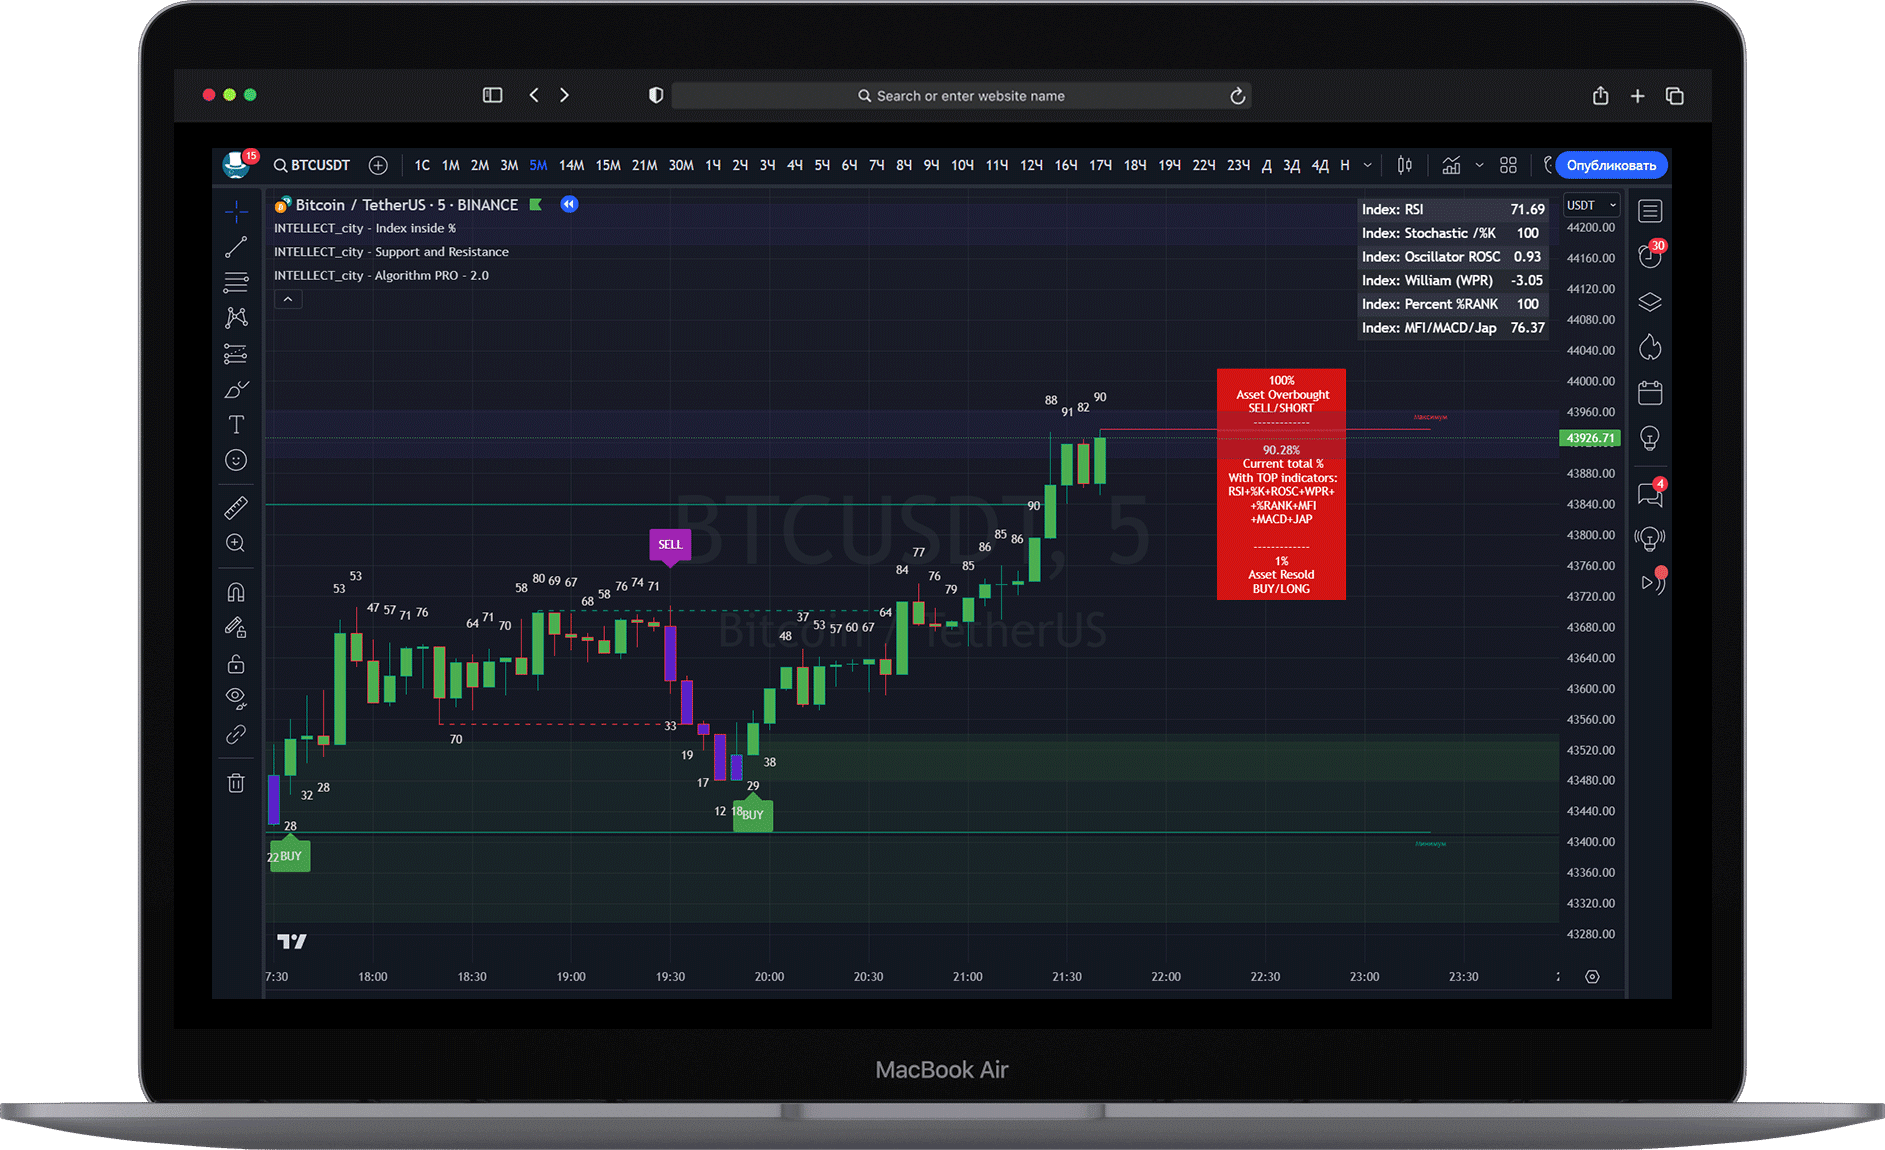
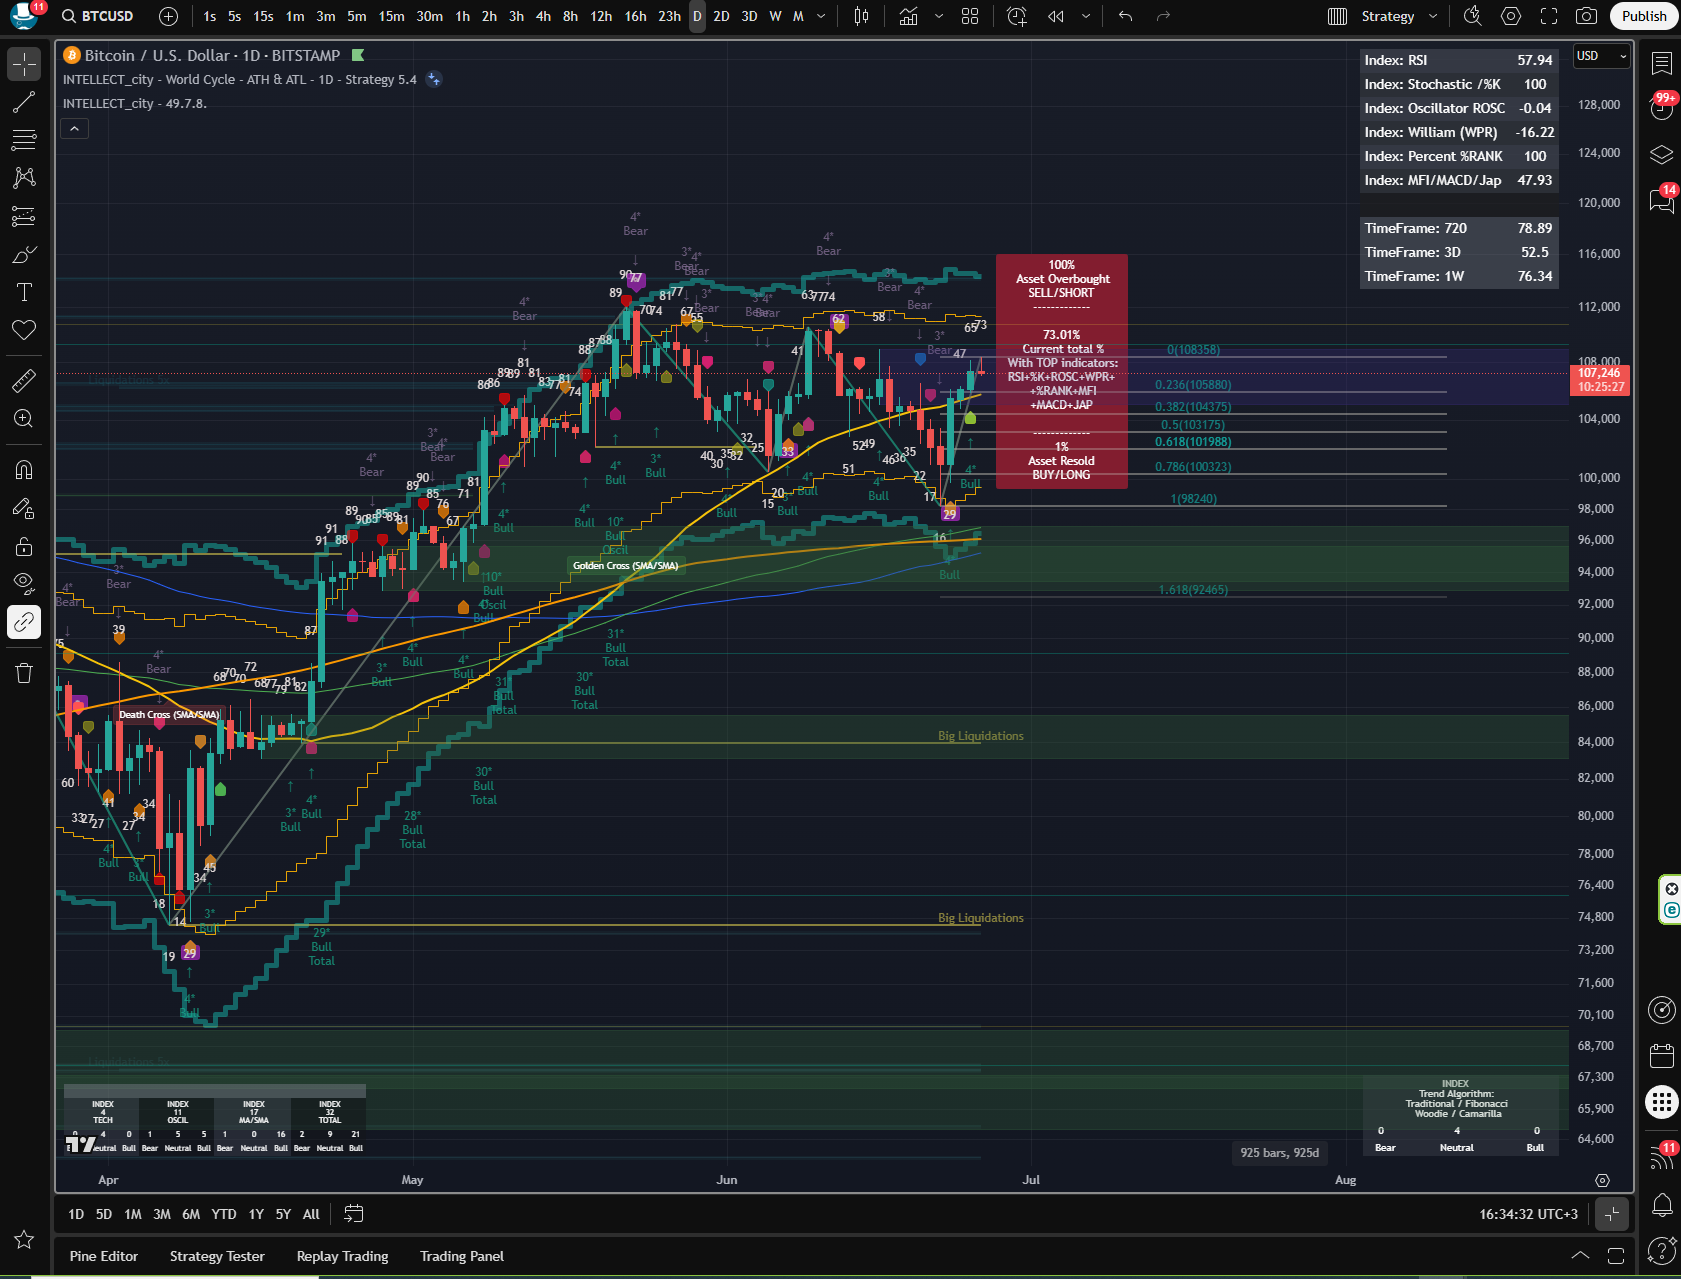
This indicator is: Global trend analysis in which indexation of 32 TOP stock indicators used in the crypto market is built in.
List of built-in indicators:
TECH \ Technical indicators:
Traditional
Fibonacci
Camarilla
Woodie
Oscillators (OSCIL) \ Oscillators:
RSI(14)
STOCH(14, 3, 3)
CCI(20)
ADX(14)
AO
Momentum(10)
MACD(12, 26)
STOCH RSI (3, 3, 14, 14)
%R(14)
Bull Bear Power
UO(7,14,28)
Moving Averages (MA\SMA) \ Moving averages:
EMA(5)
SMA(5)
EMA(10)
SMA(10)
EMA(20)
SMA(20)
EMA(30)
SMA(30)
EMA(50)
SMA(50)
EMA(100)
SMA(100)
EMA(200)
SMA(200)
Ichimoku Cloud(9, 26, 52, 26)
ALMA
VMWA(20)
HMA(9)
TOTAL (All 32 algorithms)
--------------------------
This is a very powerful indicator that will help in determining the trend movement as BULL (BUY\LONG) and BEAR (SELL\SHORT) directions.
Works on all timeframes.
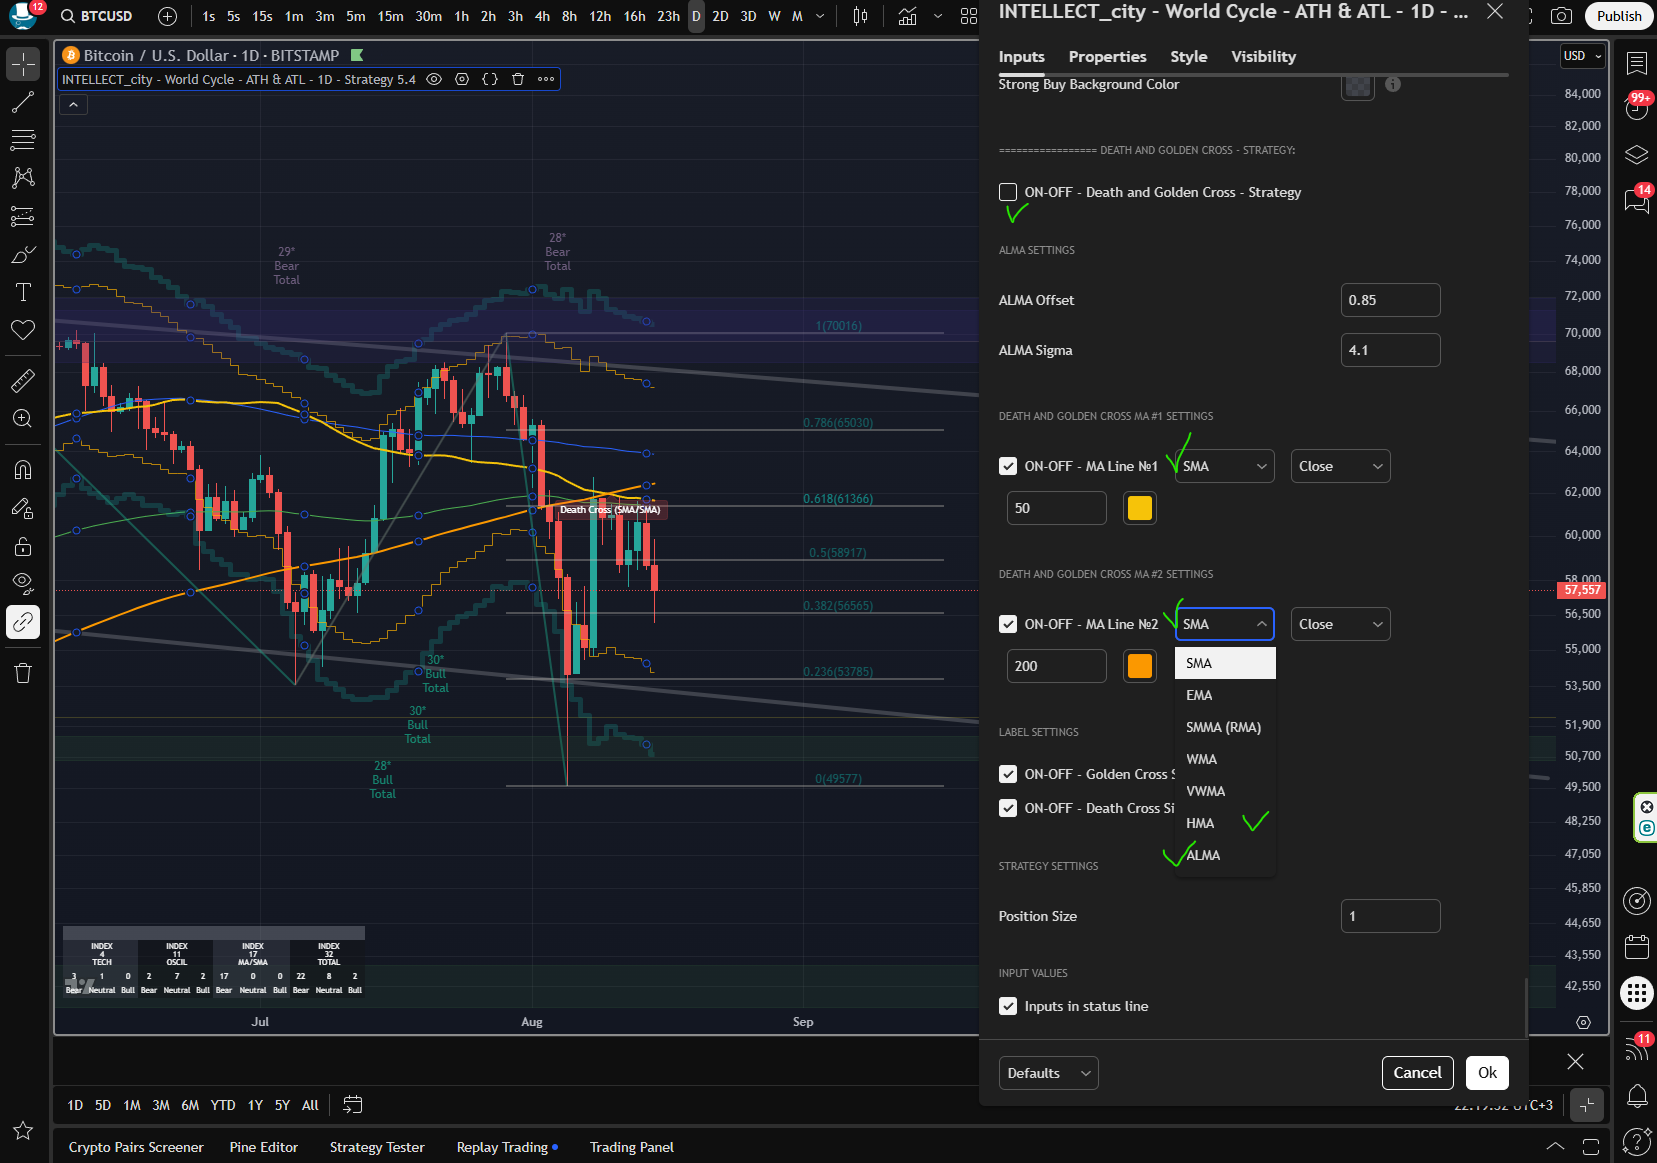
INTELLECT_city - SMA and EMA - Death and Golden Cross 50-200
This algorithm represents: graphic patterns "golden cross" and "death cross"
SMA or EMA to choose from.
You must have heard many times about this phrase: "golden cross" and "death cross" since TOP traders often use this algorithm.
SMA or EMA: which is better for "death" or "golden" cross?
SMA:
Pros: More stable signal, fewer false intersections, especially on daily or weekly timeframes. Widely used by institutional investors.
Cons: Lagging, may miss early stages of trend reversals.
When to use: For long-term strategies, stock, index, Bitcoin or less volatile assets.
EMA:
Pros: Reacts faster to price changes, useful for short-term trading or volatile markets (e.g. cryptocurrencies).
Cons: More false signals due to high sensitivity.
When to use: For intraday or swing trading, especially on H1, H4 timeframes or for highly volatile assets.
Recommendations:
Standard: Use SMA 50 and SMA 200 on daily timeframe for classic "death" or "golden" cross. This is the most recognized and reliable option.
You can also switch to a strategy by SMA, or to choose from the list:
PS: This strategy has several strategies.
PS: We recommend turning on this combination: ALMA \ HMA:
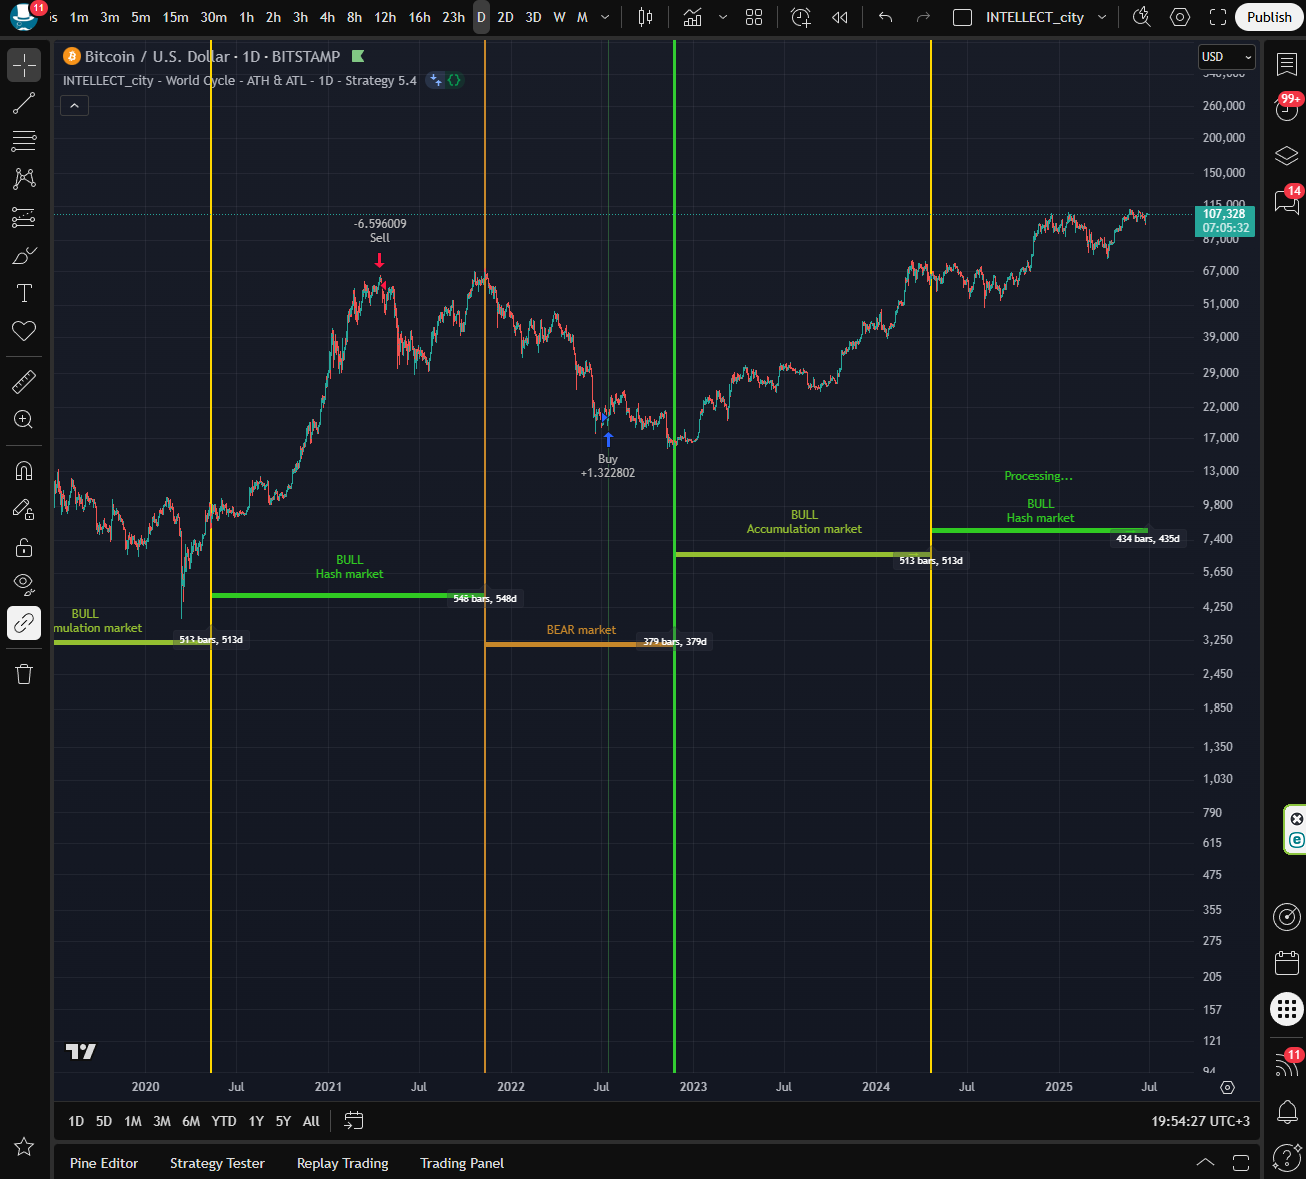
INTELLECT_city - Bull - Bear - Processing
The algorithm shows periods, Bearish or Bullish phases.
There are 3 phases:
- BULL Accumulation market - Cumulative "Bullish" period
- BULL Hash market - "Bullish" market after "Halving"
- BEAR market - "Bearish" market.
If you see the previous periods that are built into the algorithm, you can easily calculate future periods, but we all understand that the crypto market may not be predictable, but it is with this algorithm that we can calculate future indicators, and already be one step ahead of the rest.
IMPORTANT:
Algorithms are automatically updated, always update current data.
Basically, updates occur when a part of the cycle ends.
How to update? Just click on the green button that appears next to the name, or simply remove it from the chart and add it again.
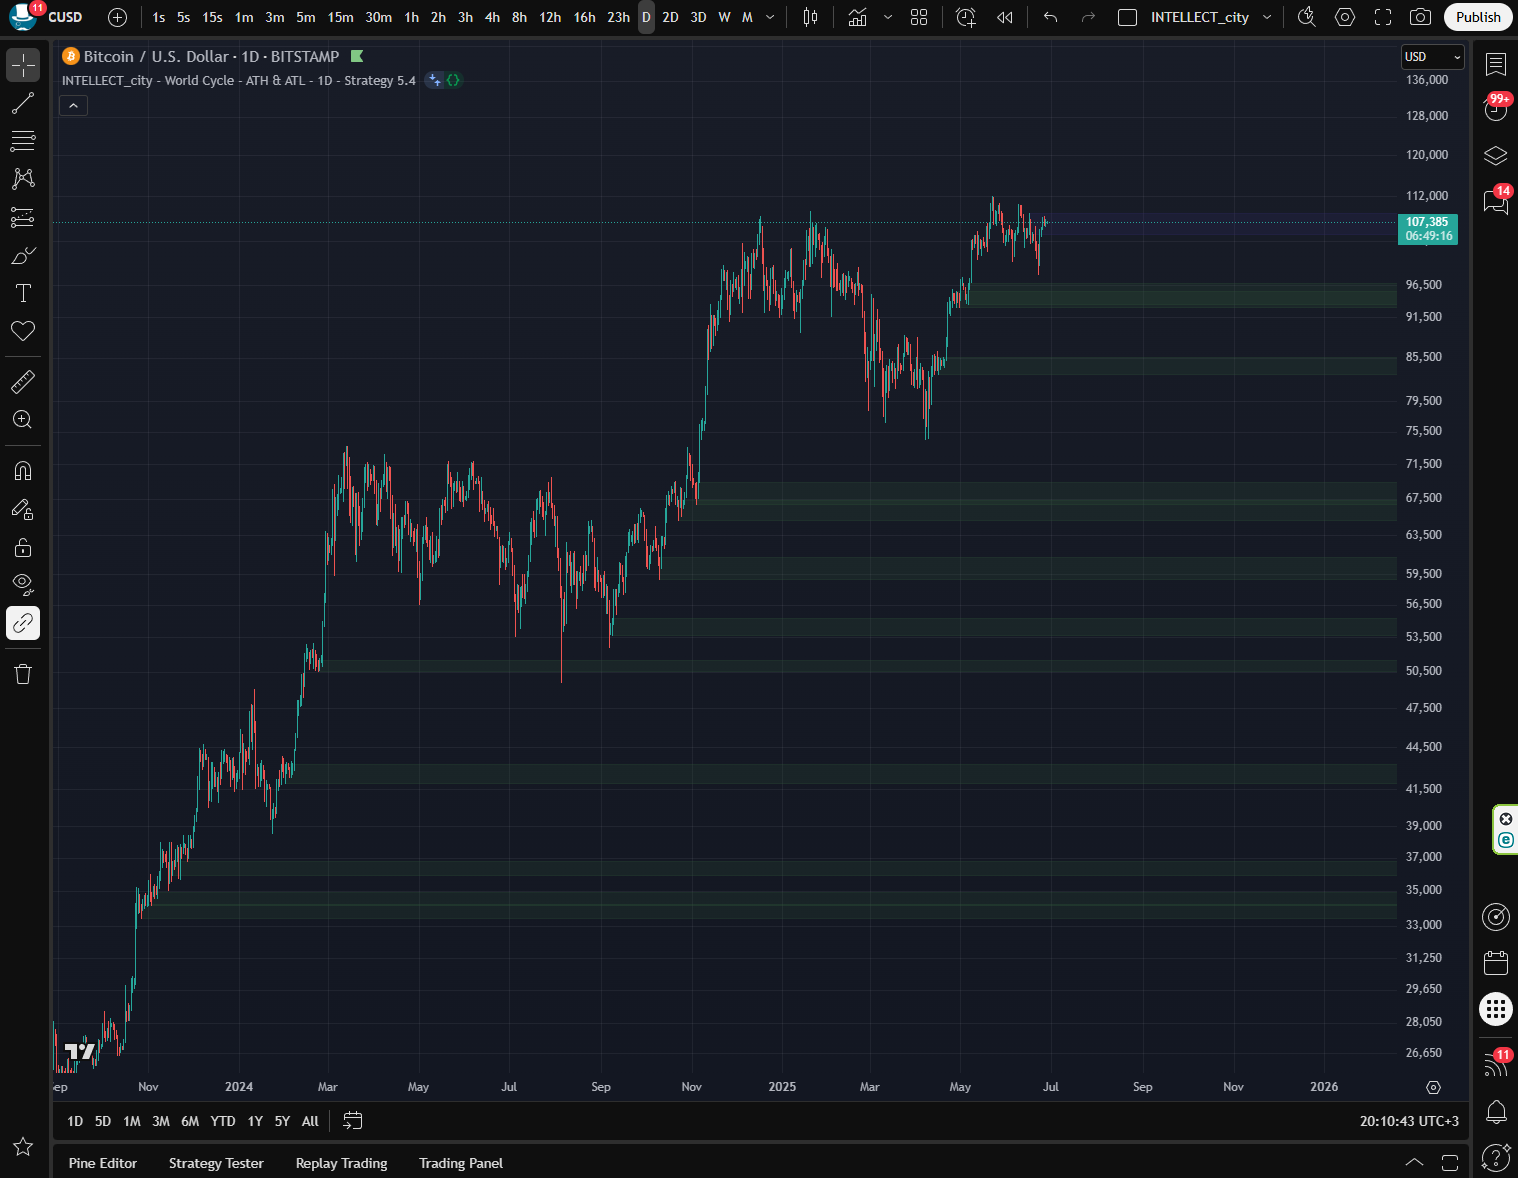
INTELLECT_city - Support and Resistance liquidity
The algorithm shows support and resistance of liquidity volume zones.
The algorithm automatically draws support and resistance on your chart, both globally and locally, with liquidity volume zones.
Blocks (purple, green) or close to these colors are liquidity volumes.
If the block is broken, the next resistance or support block is drawn.
The green stripe (Block) is the purchase zone, and close to the purple stripe (Block) is the sale zone.
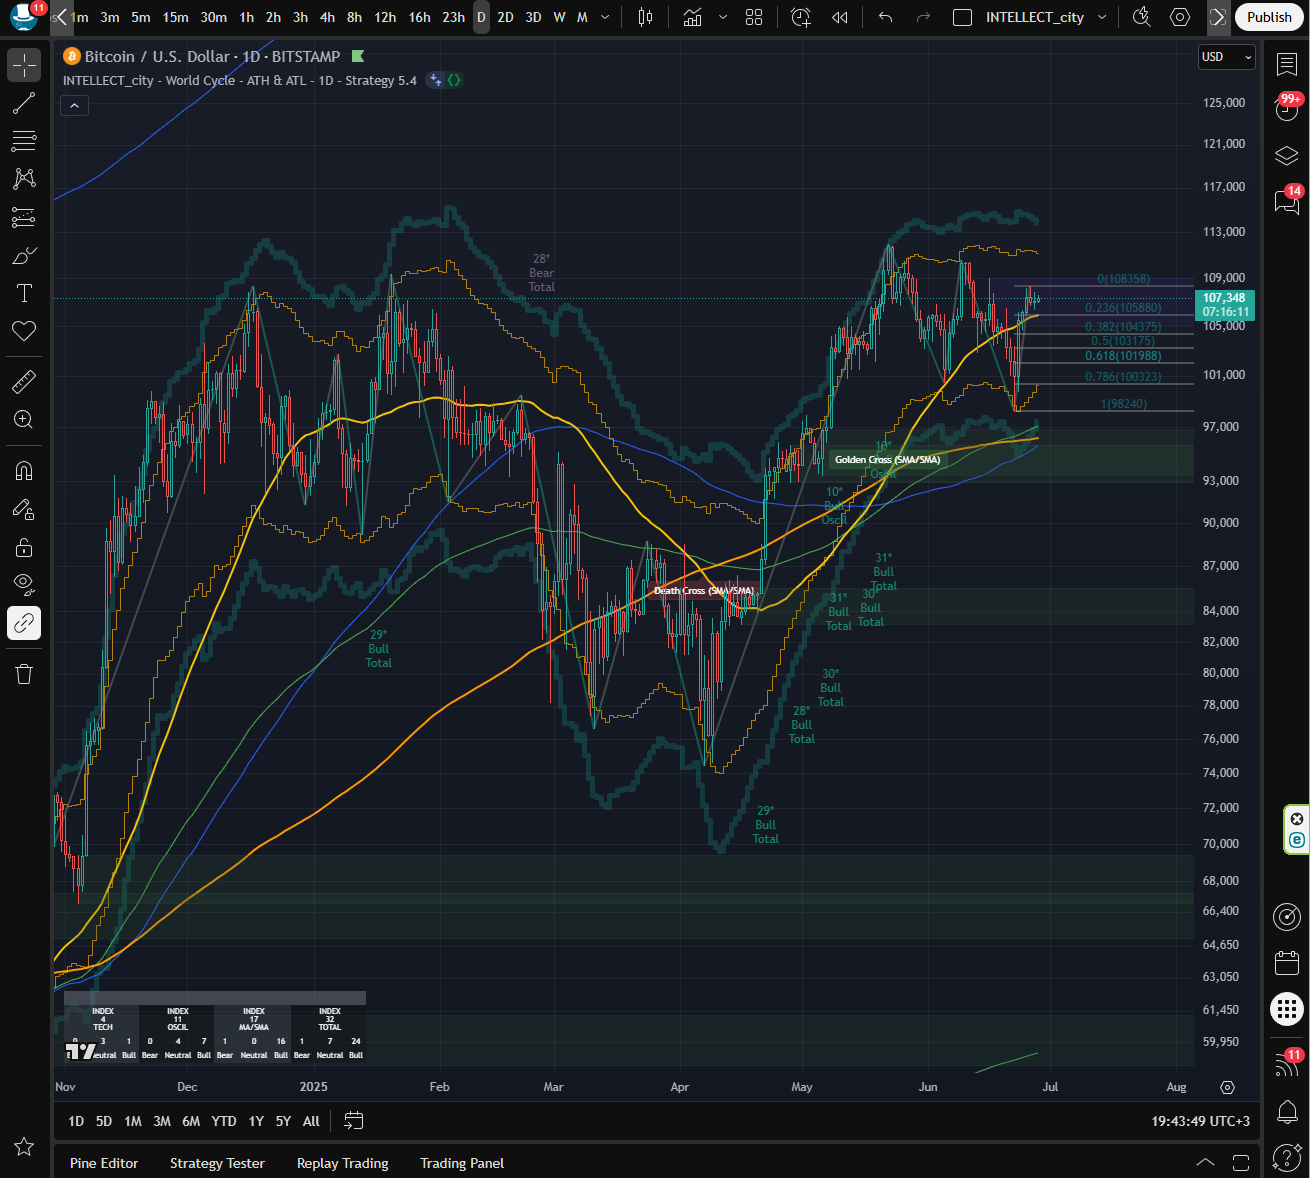
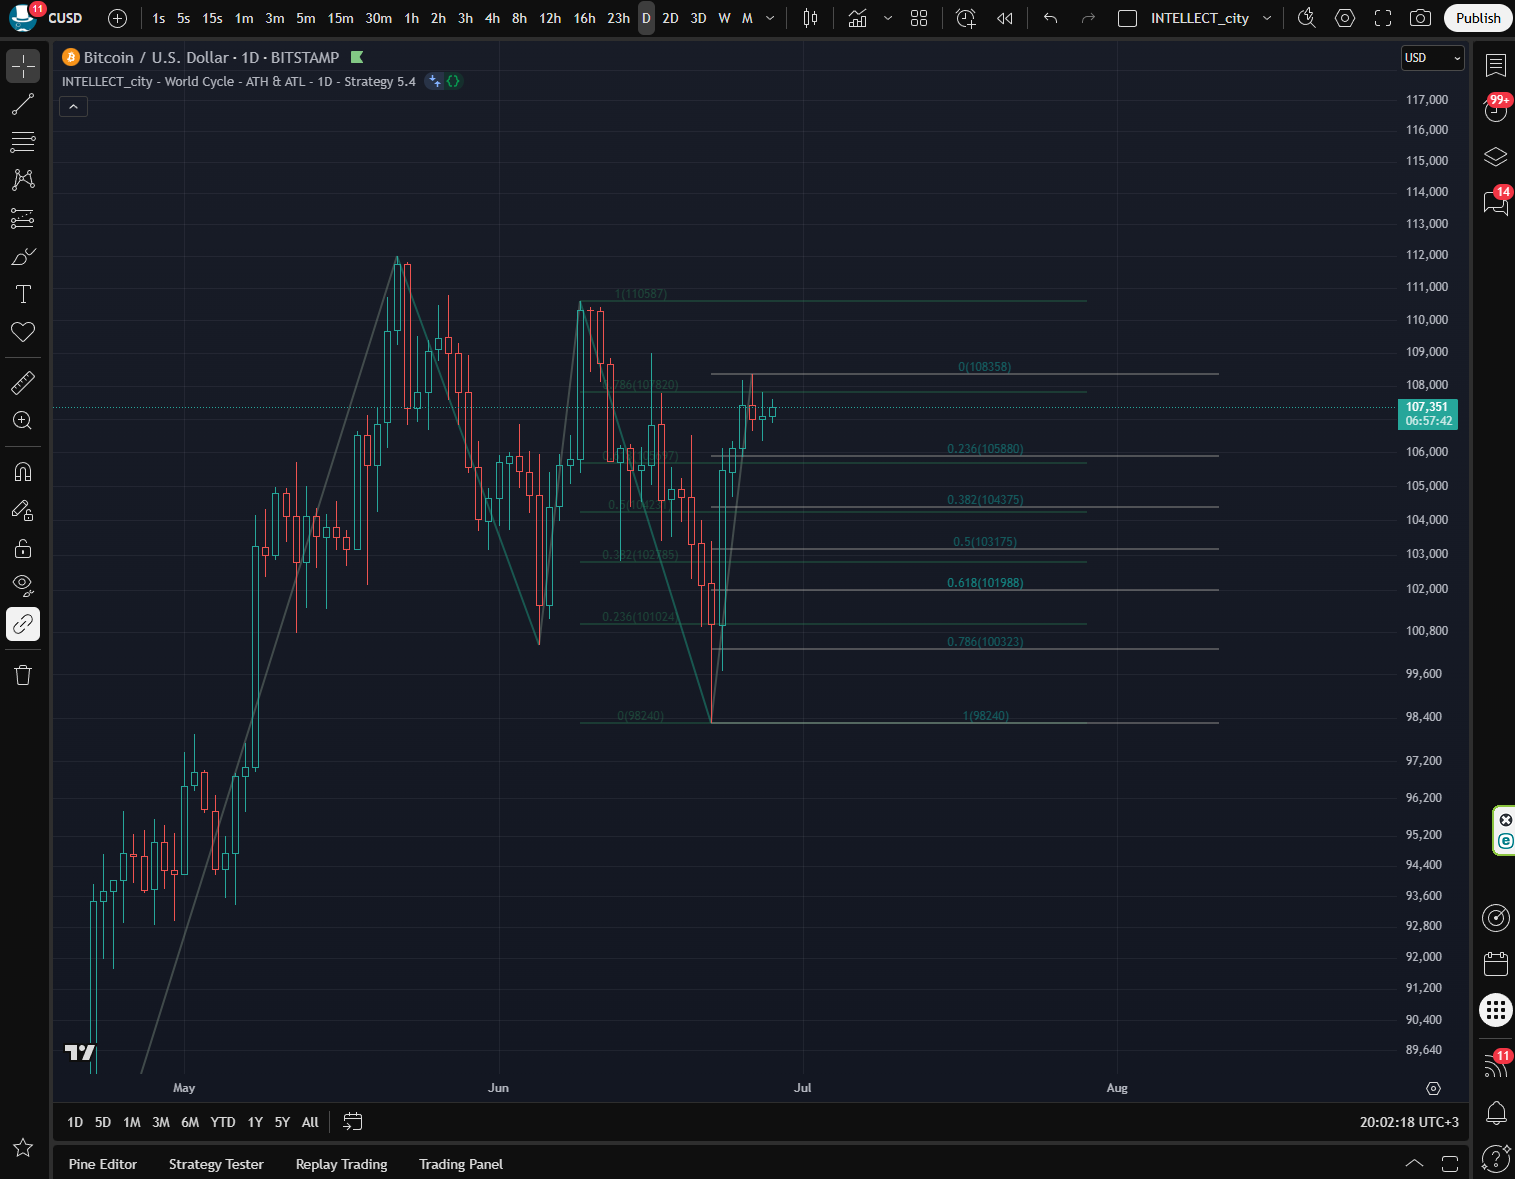
INTELLECT_city - Fibonacci auto indicator
Automatic algorithm, draws all Fibonacci levels itself. Very suitable even for advanced traders, since sometimes it is difficult to understand from which levels to draw a given pattern, the algorithm will automatically adjust to current price movements, and draw Fibonacci levels itself. Also built-in Zig Zak pattern, it also helps even TOP traders in understanding ATH and ATL of the local price, to draw ABC patterns or Fibonacci itself
What is Fibonacci:
The Fibonacci sequence is a series of numbers, where each subsequent value is equal to the sum of the two previous ones: 1, 1, 2, 3, 5, 8, 13, 21... Gradually, the ratio of adjacent numbers in the sequence approaches 1.618 and 0.618 - the ratio of the subsequent number to the previous one, and the previous one to the subsequent one, respectively. 1.618 is also called the “golden number” or the number of the golden section.
The strongest Fibonacci levels are considered to be the values: 1.618 and 0.618 - in trading they can be considered as targets.


